
Page 137 - Partition & Adsorption of Organic Contaminants in Environmental Systems
P. 137
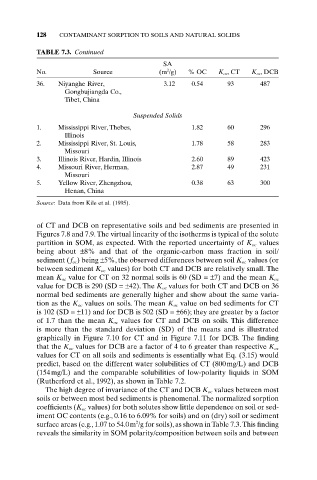
128   CONTAMINANT SORPTION TO SOILS AND NATURAL SOLIDS

           TABLE 7.3. Continued
                                              SA
                                               2
           No.             Source            (m /g)  % OC     K oc,CT  K oc, DCB
           36.   Niyanghe River,              3.12    0.54      93       487
                   Gongbujiangda Co.,
                   Tibet, China

                                      Suspended Solids
           1.    Mississippi River, Thebes,           1.82      60       296
                   Illinois
           2.    Mississippi River, St. Louis,        1.78      58       283
                   Missouri
           3.    Illinois River, Hardin, Illinois     2.60      89       423
           4.    Missouri River, Herman,              2.87      49       231
                   Missouri
           5.    Yellow River, Zhengzhou,             0.38      63       300
                   Henan, China
           Source: Data from Kile et al. (1995).


           of CT and DCB on representative soils and bed sediments are presented in
           Figures 7.8 and 7.9. The virtual linearity of the isotherms is typical of the solute
           partition in SOM, as expected. With the reported uncertainty of K oc values
           being about  ±8% and that of the organic-carbon mass fraction in soil/
           sediment (f oc ) being ±5%, the observed differences between soil K oc values (or
           between sediment K oc values) for both CT and DCB are relatively small. The
           mean K oc value for CT on 32 normal soils is 60 (SD =±7) and the mean K oc
           value for DCB is 290 (SD =±42). The K oc values for both CT and DCB on 36
           normal bed sediments are generally higher and show about the same varia-
           tion as the K oc values on soils. The mean K oc value on bed sediments for CT
           is 102 (SD =±11) and for DCB is 502 (SD =±66); they are greater by a factor
           of 1.7 than the mean  K oc values for CT and DCB on soils. This difference
           is more than the standard deviation (SD) of the means and is illustrated
           graphically in Figure 7.10 for CT and in Figure 7.11 for DCB. The finding
           that the K oc values for DCB are a factor of 4 to 6 greater than respective K oc
           values for CT on all soils and sediments is essentially what Eq. (3.15) would
           predict, based on the different water solubilities of CT (800mg/L) and DCB
           (154mg/L) and the comparable solubilities of low-polarity liquids in SOM
           (Rutherford et al., 1992), as shown in Table 7.2.
              The high degree of invariance of the CT and DCB K oc values between most
           soils or between most bed sediments is phenomenal. The normalized sorption
           coefficients (K oc values) for both solutes show little dependence on soil or sed-
           iment OC contents (e.g., 0.16 to 6.09% for soils) and on (dry) soil or sediment
                                       2
           surface areas (e.g.,1.07 to 54.0m /g for soils),as shown in Table 7.3.This finding
           reveals the similarity in SOM polarity/composition between soils and between