
Page 142 - Partition & Adsorption of Organic Contaminants in Environmental Systems
P. 142
SORPTION FROM WATER SOLUTION 133
120
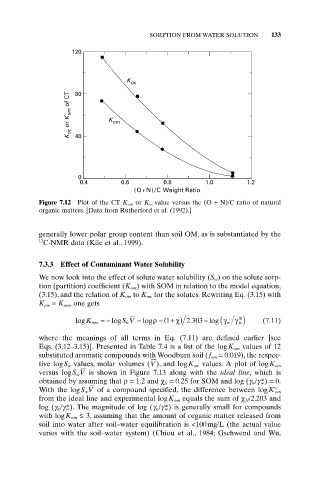
K oc
K oc or K om of CT 40 K om
80
0
0.4 0.6 0.8 1.0 1.2
(O+N)/C Weight Ratio
Figure 7.12 Plot of the CT K om or K oc value versus the (O + N)/C ratio of natural
organic matters. [Data from Rutherford et al. (1992).]
generally lower polar group content than soil OM, as is substantiated by the
13
C-NMR data (Kile et al., 1999).
7.3.3 Effect of Contaminant Water Solubility
We now look into the effect of solute water solubility (S w) on the solute sorp-
tion (partition) coefficient (K om) with SOM in relation to the model equation,
(3.15), and the relation of K om to K ow for the solutes. Rewriting Eq. (3.15) with
K pw = K om , one gets
logK om =- logS V - log - (1 + ) c . 2 303 - log(g w g * w) (7.11)
r
w
where the meanings of all terms in Eq. (7.11) are defined earlier [see
Eqs. (3.12–3.15)]. Presented in Table 7.4 is a list of the logK om values of 12
substituted aromatic compounds with Woodburn soil (f om = 0.019), the respec-
V
tive logS w values, molar volumes ( ), and logK ow values. A plot of logK om
versus logS w V is shown in Figure 7.13 along with the ideal line, which is
obtained by assuming that r= 1.2 and c S = 0.25 for SOM and log (g w/g w *) = 0.
With the logS w V of a compound specified, the difference between logK° om
from the ideal line and experimental logK om equals the sum of c H/2.203 and
log (g w/g w *). The magnitude of log (g w/g w *) is generally small for compounds
with logK om £ 3, assuming that the amount of organic matter released from
soil into water after soil–water equilibration is <100mg/L (the actual value
varies with the soil–water system) (Chiou et al., 1984; Gschwend and Wu,