
Page 143 - Partition & Adsorption of Organic Contaminants in Environmental Systems
P. 143
134 CONTAMINANT SORPTION TO SOILS AND NATURAL SOLIDS
V
TABLE 7.4. Water Solubilities (S w), Molar Volumes ( ), Octanol–Water Partition
Coefficients (K ow), and K om Values of Some Substituted Benzenes and
Polychlorinated Biphenyls (PCBs) on Woodburn Soil
a
logS w V
Compound (mol/L) (L/mol) logS w V logK om logK ow
Benzene -1.64 0.0894 -2.69 1.26 2.13
Anisole -1.85 0.109 -2.82 1.30 2.11
Chlorobenzene -2.36 0.102 -3.35 1.68 2.84
Ethylbenzene -2.84 0.123 -3.75 1.98 3.15
1,2-Dichlorobenzene -2.98 0.113 -3.98 2.27 3.38
1,3-Dichlorobenzene -3.04 0.114 -3.98 2.23 3.38
1,4-Dichlorobenzene (-3.03) 0.118 -3.96 2.20 3.39
1,2,4-Trichlorobenzene -3.57 0.125 -4.47 2.70 4.02
2-PCB (-4.57) 0.174 -5.33 3.23 4.51
2,2¢-PCB (-5.08) 0.189 -5.57 3.68 4.80
2,4¢-PCB (-5.28) 0.189 -5.97 3.89 5.10
2,4,4¢-PCB (-5.98) 0.204 -6.67 4.38 5.62
Source: Data from Chiou et al. (1983).
a
Values at 20 to 25°C. The numbers in parentheses are the supercooled liquid solubilities esti-
mated according to Eqs. (3.9) and (3.25) with DH ¯ fus/T m = 56.5J/mol·K.
6
°
Log K om V _
4
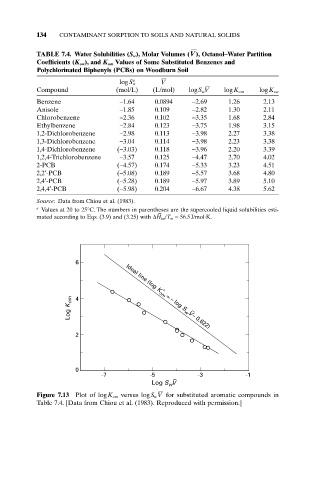
Ideal line (log K om = – log S w – 0.622)
2
0
-7 -5 _ -3 -1
Log S V
w
Figure 7.13 Plot of logK om versus logS w V for substituted aromatic compounds in
Table 7.4. [Data from Chiou et al. (1983). Reproduced with permission.]