
Page 230 - Partition & Adsorption of Organic Contaminants in Environmental Systems
P. 230
UPTAKE BY SMALL PLANT ROOTS FROM WATER 221
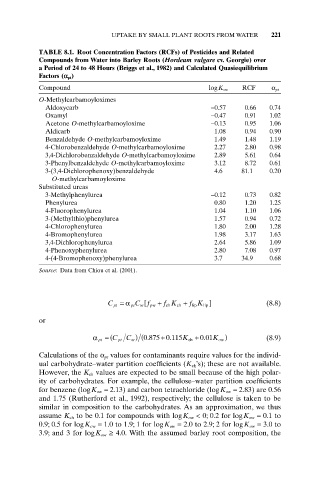
TABLE 8.1. Root Concentration Factors (RCFs) of Pesticides and Related
Compounds from Water into Barley Roots (Hordeum vulgare cv. Georgie) over
a Period of 24 to 48 Hours (Briggs et al., 1982) and Calculated Quasiequilibrium
Factors (a pt)
Compound logK ow RCF a pt
O-Methylcarbamoyloximes
Aldoxycarb -0.57 0.66 0.74
Oxamyl -0.47 0.91 1.02
Acetone O-methylcarbamoyloxime -0.13 0.95 1.06
Aldicarb 1.08 0.94 0.90
Benzaldehyde O-methylcarbamoyloxime 1.49 1.48 1.19
4-Chlorobenzaldehyde O-methylcarbamoyloxime 2.27 2.80 0.98
3,4-Dichlorobenzaldehyde O-methylcarbamoyloxime 2.89 5.61 0.64
3-Phenylbenzaldehyde O-methylcarbamoyloxime 3.12 8.72 0.61
3-(3,4-Dichlorophenoxy)benzaldehyde 4.6 81.1 0.20
O-methylcarbamoyloxime
Substituted ureas
3-Methylphenylurea -0.12 0.73 0.82
Phenylurea 0.80 1.20 1.25
4-Fluorophenylurea 1.04 1.10 1.06
3-(Methylthio)phenylurea 1.57 0.94 0.72
4-Chlorophenylurea 1.80 2.00 1.28
4-Bromophenylurea 1.98 3.17 1.63
3,4-Dichlorophenylurea 2.64 5.86 1.09
4-Phenoxyphenylurea 2.80 7.08 0.97
4-(4-Bromophenoxy)phenylurea 3.7 34.9 0.68
Source: Data from Chiou et al. (2001).
w [
C pt = a pt C f pw + f K + f K ] (8.8)
ch
ch
lip
lip
or
a pt = ( C pt C ) (0 875 0 115. + . K + 0 01 K ow ) (8.9)
.
w
ch
Calculations of the a pt values for contaminants require values for the individ-
ual carbohydrate–water partition coefficients (K ch’s); these are not available.
However, the K ch values are expected to be small because of the high polar-
ity of carbohydrates. For example, the cellulose–water partition coefficients
for benzene (logK ow = 2.13) and carbon tetrachloride (logK ow = 2.83) are 0.56
and 1.75 (Rutherford et al., 1992), respectively; the cellulose is taken to be
similar in composition to the carbohydrates. As an approximation, we thus
assume K ch to be 0.1 for compounds with logK ow < 0; 0.2 for logK ow = 0.1 to
0.9; 0.5 for logK ow = 1.0 to 1.9; 1 for logK ow = 2.0 to 2.9; 2 for logK ow = 3.0 to
3.9; and 3 for logK ow ≥ 4.0. With the assumed barley root composition, the