
Page 97 - Partition & Adsorption of Organic Contaminants in Environmental Systems
P. 97
88 ADSORPTION OF VAPORS ON MINERALS AND OTHER SOLIDS
TABLE 6.1. N 2 Monolayer Capacities, Total Surface Areas, Micropore Volumes by
t-Plot, and Nonporous Surface Areas of Selected Solids
Total Micropore
Q m(N 2) Surface Volume Nonporous
2
2
Solid (mg/g) Area (m /g) (mL/g) Area (m /g)
Silica (Alfa Aesar Co.) 2.43 8.2 7 ¥ 10 -4 6.9
Alumina (Alcoa Co.) 2.74 9.3 3 ¥ 10 -4 9.2
Goethite (Ward’s Nat. Sci.) 0.77 2.7 2 ¥ 10 -4 2.6
Kaolinite (KGa-2) 6.03 21.0 0 21.1
Ca-SAz-1 (homoionic) 20.5 71.5 3.0 ¥ 10 -2 17.2
K-SAz-1 (homoinoic) 27.9 97.1 3.9 ¥ 10 -2 26.4
Activated carbon (Calgon Co.) 300 986 0.48 110
Source: Data on kaolinite, Ca-montmorillonite (Ca-SAz-1), and K-montmorillonite (K-SAz-1)
from Rutherford et al. (1997) and the rest from C. T. Chiou (unpublished research).
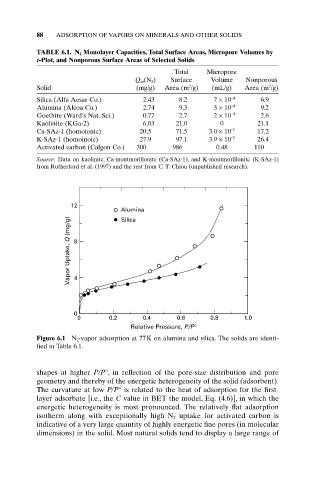
12
Alumina
Vapor Uptake, Q (mg/g) 8 4
Silica
0
0 0.2 0.4 0.6 0.8 1.0
Relative Pressure, P/P°
Figure 6.1 N 2-vapor adsorption at 77K on alumina and silica. The solids are identi-
fied in Table 6.1.
shapes at higher P/P°, in reflection of the pore-size distribution and pore
geometry and thereby of the energetic heterogeneity of the solid (adsorbent).
The curvature at low P/P° is related to the heat of adsorption for the first-
layer adsorbate [i.e., the C value in BET the model, Eq. (4.6)], in which the
energetic heterogeneity is most pronounced. The relatively flat adsorption
isotherm along with exceptionally high N 2 uptake for activated carbon is
indicative of a very large quantity of highly energetic fine pores (in molecular
dimensions) in the solid. Most natural solids tend to display a large range of