
Page 93 - Partition & Adsorption of Organic Contaminants in Environmental Systems
P. 93
84 CONTAMINANT PARTITION AND BIOCONCENTRATION
TABLE 5.7. Lipid-Based Bioconcentration Factors (BCF lipid) of Chlorinated Organic
Compounds in Four Biota Species in the Calcasieu River Estuary, Louisiana
log (BCF) lipid
Atlantic Blue Spotted Blue
Compound Croakers Crabs Sea Trout Catfish
o-Dichlorobenzene 3.94 4.46 3.79 3.82
m-Dichlorobenzene 3.60 3.86 3.25 3.40
p-Dichlorobenzene 3.91 4.53 4.09 3.51
1,3,5-Trichlorobenzene 4.40 4.45 3.51 4.22
1,2,4-Trichlorobenzene 4.76 4.90 3.54 4.68
1,2,3-Trichlorobenzene 4.54 4.77 3.13 4.49
1,2,3,5-Tetrachlorobenzene 5.05 5.20 4.27 4.90
1,2,3,4-Tetrachlorobenzene 5.46 5.70 4.68 5.30
Pentachlorobenzene 5.93 6.12 4.96 5.57
Hexachlorobenzene 6.42 6.71 5.96 5.98
Hexachloro-1,3-butadiene 4.50 3.97 4.06 4.55
Source: Data from Pereira et al. (1988).
6
Atlantic croakers
Blue crabs
Bioconcentration Factor, Log (BCF) lipid 5
Spotted seatrout
6
Catfish
4
3
3 4 5 6 7
Triolein-Water Partition Coefficient, Log K tw
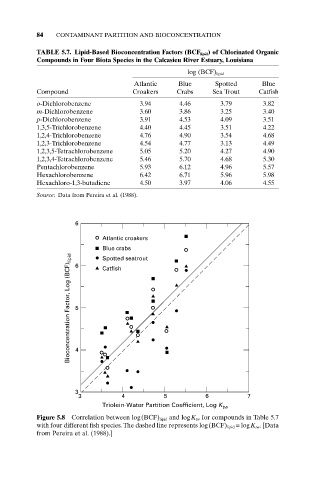
Figure 5.8 Correlation between log(BCF) lipid and logK tw for compounds in Table 5.7
with four different fish species. The dashed line represents log(BCF) lipid = logK tw. [Data
from Pereira et al. (1988).]