
Page 124 -
P. 124
4.3 Model-Free Techniques 1 11
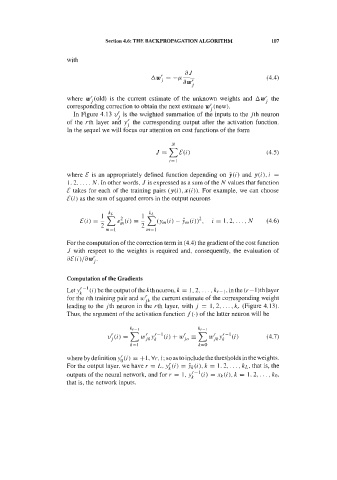
Figure 4.27. Parzen window estimation of a one-dimensional distribution, using a
rectangular window.
The Parzen window method is a generalization of this formula, such that,
instead of a hard-limiting hypercube window p, we use any smooth window
satisfying simple conditions of positiveness and unitary volume. The multivariate
normal function is a frequently used window function. The role of this smoothing
window, known as inrerpolating kernel, is to weight the contribution of each
training set vector xi to the pdf estimate at x, in accordance with its deviation from
x. As for the smoothing parameter h(n), which must vary inversely with n, Duda
and Hart (1973) suggest 1 / & . This can be taken as a first guess to be adjusted
experimentally. Concerning the choice of kernel function p, the normal function
with estimated covariance is in fact the optimal choice for a large family of
symmetric distributions that include the normal pdf itself (see Fukunaga, 1990).
Let us consider the LogNorm dataset in the Parzen.xls file (see Appendix A),
which has a lognormal distribution characterized by a left asymmetry. Figure 4.28
illustrates the influence of the number of points and the smoothing factor h(n) on
the density estimate. Notice also the difficulty in obtaining a good adjustment of
the peaked part of the distribution, requiring a high number of training samples.
Even for smoother distributions, such as the normal one, we may need a large
training set size (see Duda and Hart, 1973) in order to obtain an estimate that
follows the true distribution closely. The problem is even worse when there is more
than one dimension, due to the curse of dimensionality already referred to
previously. The large datasets necessary for accurate pdf estimation may be a
difficulty in the application of the method.
Let us now see how the Parzen window method can be applied to real data. For
this purpose let us use the cork stoppers data (two classes) and feature ARM. This
feature has an unknown asymmetrical distribution with a clear deviation from the
normal distribution. The Parzen window method seems, therefore, a sensible
alternative to the Bayesian approach. Figure 4.29 shows the Parzen window
estimates of the distributions, also included in the Parzen.xls file. From these
distributions it is possible to select a threshold for class discrimination. Choosing
the threshold corresponding to the distribution intersection point, and assuming
equal prevalences, the overall training set error is 24%. This is in fact a very
reasonable error rate compared to the 23% obtained in 4.1.1 for the much more
discriminating feature N.