
Page 132 -
P. 132
4.3 Model-Free Techniques 119
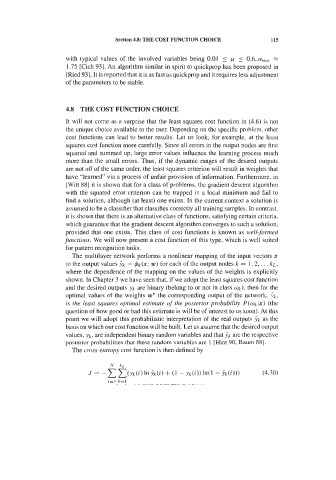
A non-informative ROC curve corresponds to the diagonal line of Figure 4.33,
with sensitivity = 1 - specificity. In this case, the true detection rate of the
abnormal situation is the same as the false detection rate. The best compromise
decision of sensitivity=specificity=0.5 is then as good as flipping a coin.
One of the uses of the ROC curve is related to the issue of choosing the best
decision threshold that discriminates both situations, in the case of the example, the
presence of the impulses from the presence of the noise alone. Let us address this
discriminating issue as a cost decision issue as we have done in section 4.2.1.
Representing the sensitivity and specificity of the method for a threshold A by s(A)
andf(A) respectively, and using the same notation as in (4-17), we can write the
total risk as:
In order to obtain the best threshold we minimize the risk R by differentiating
and equalling to zero, obtaining then:
The point of the ROC curve where the slope has the value given by formula
(4-42) represents the optimum operating point or, in other words, corresponds to
the best threshold for the two-class problem. Notice that this is a model-free
technique of choosing a feature threshold for discriminating two classes, with no
assumptions concerning the specific distributions of the patterns.
Let us now assume that, in a given situation, we assign zero cost to correct
decisions, and a cost that is inversely proportional to the prevalences to a wrong
decision. Then the slope of the optimum operating point is at 45", as shown in
Figure 4.33b. For the impulse detection example the best threshold would be
somewhere between 2 and 3.
Another application of the ROC curve is in the comparison of classification
methods. Let us consider the FHR Apgar dataset, containing several parameters
computed from foetal heart rate (FHR) tracings obtained previous to birth, as well
as the so-called Apgar index. This is a ranking index, measured on a one-to-ten
scale, and evaluated by obstetricians taking into account several clinical
observations of a newborn baby. Imagine that two FHR parameters are measured,
ABLTV and ABSTV (percentage of abnormal long term and short term variability,
respectively), and one wants to elucidate which of these parameters is better in
clinical practice for discriminating an Apgar > 6 (normal situation) from an
Apgar I6 (abnormal or suspect situation).