
Page 133 -
P. 133
120 4 Statistical Classification
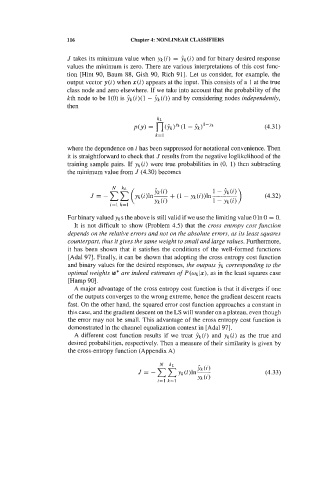
Figure 4.34. ROC curves for the FHR Apgar dataset, corresponding to features
ABLTV and ABSTV.
We have already seen in 4.2.1 how prevalences influence classification
decisions. As illustrated in Figure 4.13, for a two-class situation, the decision
threshold is displaced towards the class with the smaller prevalence. Consider that
the test with any of the FHR parameters is applied to a population where the
prevalence of the abnormal situation is low. Then, for the mentioned reason, the
decision maker should operate in the lower left part of the ROC curve in order to
keep FPR as small as possible, otherwise, given the high prevalence of the normal
situation, a high rate of false alarms would be obtained. Conversely, if the test is
applied to a population with a high prevalence of the abnormal situation. the
decision maker should adjust the decision threshold to operate on the FPR high
part of the curve.
Briefly, in order for our classification method to perform optimally for a large
range of prevalence situations, we would like to have an ROC curve very near the
perfect test curve, i.e., with an underlying area of 1. It seems, therefore, reasonable
to select from among the candidate classification methods the one that has an ROC
curve with the highest underlying area, which, for the FHR-Apgar example, would
amount to selecting the ABSTV parameter as the best diagnostic method.
The area under the ROC curve represents the probability of correctly answering
the two-alternative-forced-choice problem. where an observer, when confronted
with two objects, one randomly chosen from the normal class and the other
randomly chosen from the abnormal class. must decide which one belongs to the
abnormal class. For a perfect classification method, this area is one (the observer
always gives the correct answer). For a non-informative classification method, the
area is 0.5. The higher the area, the better the method is.