
Page 145 -
P. 145
132 4 Statistical Classification
and node classification based on the separability properties of the features. Notice
from (4-50) that in order to obtain a class classification performance that is better
than the one obtained by a non-hierarchical approach, one must have very high
performances at each node. For instance, if for the tree in Figure 4.38, both
Pc(n(12)l I,) and PC(& ( 12) have a value of 0.94, then PC(&) = 0.94~ = 0.88. With a
larger tree if this 0.94 correct classification rate is iterated 4 times one obtains an
error of 22%! The error can therefore degrade drastically along a tree path.
Let us now illustrate a practical tree classifier design using the Breast Tissue
dataset (electric impedance measurements of freshly excized breast tissue) with 6
classes denoted car (carcinoma), fad (fibro-adenoma), gla (glandular), mas
(mastopathy), con (connective) and adi (adipose). Some features of this dataset can
be well modeled by a normal distribution in some classes, namely 10, AREA-DA
and IPMAX. Performing a Kruskal-Wallis analysis, it is readily seen that all the
features have discriminative capabilities and that it is practically impossible to
discriminate between classes gla, fad and mas. The low dimensionality ratio of this
dataset for the individual classes (e.g. only 14 cases for class con) strongly
suggests a decision tree approach, with the use of merged classes and a greatly
reduced number of features at each node.
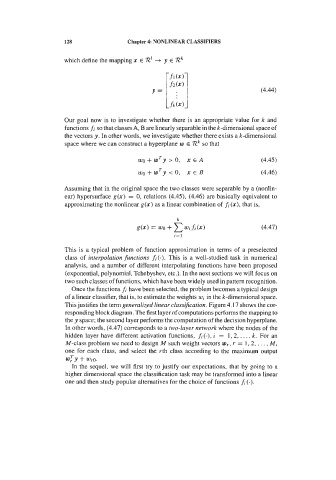
iC CLASS: car
+ CLASS:fad
0 CLASS: mas
A CLASS: gla
CLASS: con
. 1
-200 300 800 1300 1800 2300 2800
10
Figure 4.39. Scatter plot of six classes of breast tissue using features I0 and
PA500.
As I0 and PA500 are promising features, it is worthwhile to look at the
respective scatter diagram shown in Figure 4.39. Two clusters are visually
identified: one corresponding to {con, adi}, the other to {mas, gla, fad, car}.