
Page 146 -
P. 146
4.6 Tree Classifiers 133
Factor analysis also reveals the existence of a factor strongly correlated with
PA500, the other correlated with 10. Briefly, the data structure and the results of
the feature assessment phase strongly suggest using a first stage that separates the
mentioned clusters. The best results for this discrimination use I0 alone with a
threshold of IO=600, achieving zero errors.
-5 5 15 25 35 45
AREA-DA
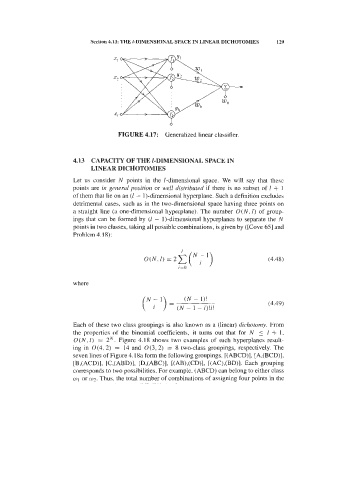
Figure 4.40. Scatter plot of breast tissue classes car and (mas, gla, fad} (denoted
not car) using features AREA-DA and IPMAX, showing the linear discriminant
separating the two classes.
At stage two we attempt the most useful discrimination from the medical point
of view: class car (carcinoma) vs. wad, mas, gla). Using discriminant analysis this
can be performed with an overall training set error of about 8%, using features
AREA-DA and IPMAX.
Figure 4.40 shows the corresponding linear discriminant. Performing two
randomized runs using the partition method in halves (half of the samples for
design and the other half for testing), an average test set error of 8.6% was
obtained, quite near the design set error. At level 2 the discrimination con vs. adi
can also be performed with feature I0 (threshold IO=1550), with zero errors for adi
and 14% errors for con.
With these results we can establish the decision tree shown in Figure 4.41. At
each level of the decision tree a decision function is used, shown in Figure 4.41 as
a decision rule to be satisfied. The left descendent tree branch corresponds to
compliance with a rule, i.e., to a "Yes" answer; the right descendent tree branch
corresponds to a "No" answer.
Since a small number of features is used at each level, one for the first level and
two for the second level, respectively, we maintain a reasonably high