
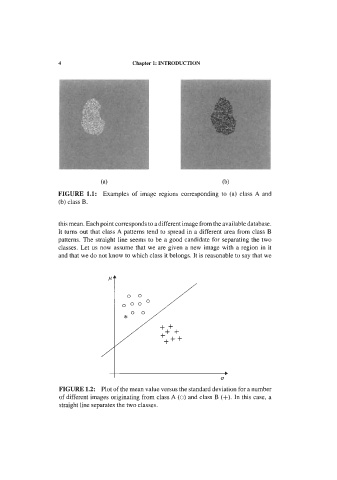
Page 21 -
P. 21
1.2 Pattern Similarity and  PR  Tasks   7

         As can be appreciated this time-series prediction  task is an example of a broader
       class of tasks known in mathematics as function approximation or regression /ask.
       A  system  providing  the  regression  solution  will  usually  make  forecasts  (black
       circles  in Figure  1.5) somewhat  deviated  from the  true  value  (curve, idem). The
       difference between  the  predicted  value  and  the  true  value, also  known as  target
       value,  constitutes  a prediction  error.  Our  aim  is  a  solution  yielding  predicted
       values similar to the targets, i.e., with small errors.
         As  a  matter  of  fact  regression  tasks  can  also  be  cast  under  the  form  of
       classification  tasks.  We can  divide  the  dependent  variable  domain  (r,)  into
       sufficiently small  intervals and  interpret the regression solution  as  a classification
       solution,  where  a correct  classification corresponds  to  a  predicted  value  falling
       inside the correct interval = class. In this sense we can view the sequence of values
       as  a feature  vector,  [r,  rg  rc  Euro-USD-rate  Interest-rate-6-months]' and
       again,  we  express  the  similarity  in  terms  of a  distance,  now  referred  to  the
       predicted  and  target values (classifications). Note that a coarse regression could  be:
       predict  whether  or  not  r,(t)  is  larger  than  the  previous  value,  r,,(t-I). This  is
       equivalent  to  a  2-class  classification problem  with  the  class  labelling  function
       sgn(ro(/)- r[,(t- 1)).
         Sornetinies  regression  tasks are  also  performed  as  part  of a classification. For
       instance,  in  the  recognition  of living  tissue  a  merit  factor  is  often  used  by
       physicians,  depending  on several features such as colour, texture, light reflectance
       and  density of blood  vessels. An automatic tissue recognition system attempts then
       to regress the  merit  factor  evaluated  by the human expert, prior  to establishing  a
       tissue classification.


                                    June 2000


                      /i~rnl A  Firm B  Finn C 1  1 USD 1  Interest 1  ~


                     ,  share   share  1  share  I   1 .O5 €  ,  4.66% ,
                                                   rate (6~)'
                        r-r           r,
                     I         '-0


       Figure 1.5.  Share value forecast one-day ahead,  r,,  r~, r( are share values of three
       firms. Functional approximation (black circles) of the true value of r, (solid curve),
       is shown  for June  16  depending  on the values of the shares, euro-dollar  exchange
       rate and  interest rate for June  15.