
Page 24 -
P. 24
10 1 Basic Notions
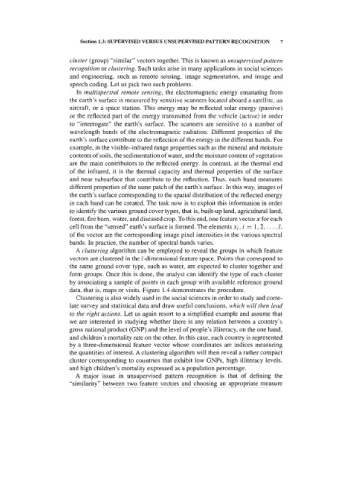
signals acquired by placing electrodes on the patient's chest. Figure 1.8 presents
four ECGs, each one corresponding to a distinct physiological condition:
N - normal; LVH - left ventricle hypertrophy; RVH - right ventricle hypertrophy;
MI - myocardial infarction.
Figure 1.8. ECGs of 4 diagnostic classes: (N) Normal; (LVH) Left ventricular
hypertrophy; (RVH) Right ventricular hypertrophy; (MI) Myocardial infarction.
Each ECG tracing exhibits a "wave packet" that repeats itself in a more or less
regular way over time. Figure 1.9 shows an example of such a "wave packet",
whose components are sequentially named P, Q, R, S and T. These waves reflect
the electrical activity of distinct parts of the heart. A P wave reflects the atrial
activity of the heart. The Q, R, S and T waves reflect the subsequent ventricular
activity.
Figure 1.9. ECG wave packet with sequentially named waveforms P, Q, R, S, T.
Cardiologists learn to interpret the morphology of these waves in
correspondence with the physiological state of the heart. The situation can be
summarized as follows:
- There is a set of clusses (states) in whlch can be found a certain studied entity.
In the case of the heart we are considering the mentioned four classes.
- Corresponding to each class (state) is a certain set of representations (signals,
images, etc.), thepatrerns. In the present case the ECGs are the patterns.