
Page 103 - Percolation Models for Transport in Porous Media With
P. 103
96 CHAPTER 5. NON-STEADY STATE TWO-PHASE FLOW
I
I
I
I
.r~
IUD .r/d
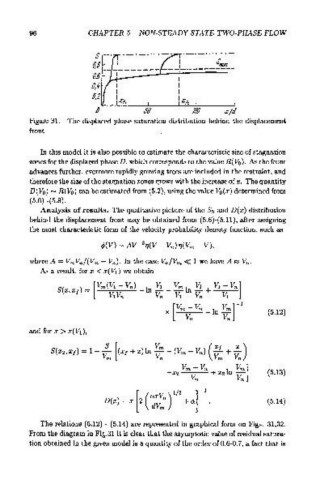
Figure 31: The displaced phase saturation distribution behind the displacement
front
In this model it is also possible to estimate the characteristic size of stagnation
zones for the displaced phaseD, which corresponds to the value R(Vo). As the front
advances further, evermore rapidly growing trees are included in the restraint, and
therefore the size of the stagnation zones grows with the increase of x. The quantity
D(V 0 ),..., R(Vo) can be estimated from (5.2}, using the value V 0(x) determined from
(5.6} -(5.8}.
Analysis of results. The qualitative picture of the S0 and D(x) distribution
behind the displacement front may be obtained from {5.6}-(5.11}, after assigning
the most characteristic form of the velocity probability density function, such as
where A= Vm Vn/(Vm - Vn)· In the case Vn/Vm « 1 we have A~ Vn.
As a result, for x < x(Vi) we obtain
(5.12}
and for x > x(Vi },
(5.13}
[ 1/2 l-1
D(x) = x 2 ( ~~n) +a (5.14}
The relations {5.12} - (5.14} are represented in graphical form on Figs. 31,32.
From the diagram in Fig.31 it is clear that the asymptotic value of residual satura-
tion obtained in the given model is a quantity of the order of 0.6-0. 7, a fact that is