
Page 181 - Percolation Models for Transport in Porous Media With
P. 181
178 CHAPTER 10 PRODUCTION CHANGE: ELECTRIC ACTION
Q,2
14 26 t2 T,day
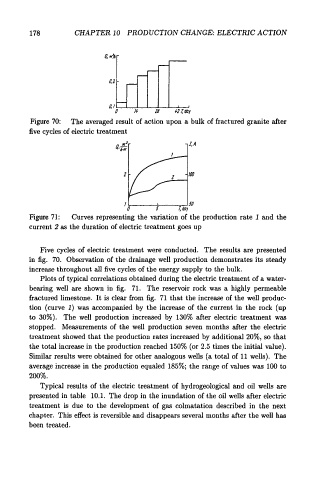
Figure 70: The averaged result of action upon a bulk of fractured granite after
five cycles of electric treatment
I, A
!:----+-----,,...,..J!D
0 5 T,day
Figure 71: Curves representing the variation of the production rate 1 and the
current 2 as the duration of electric treatment goes up
Five cycles of electric treatment were conducted. The results are presented
in fig. 70. Observation of the drainage well production demonstrates its steady
increase throughout all five cycles of the energy supply to the bulk.
Plots of typical correlations obtained during the electric treatment of a water-
bearing well are shown in fig. 71. The reservoir rock was a highly permeable
fractured limestone. It is clear from fig. 71 that the increase of the well produc-
tion (curve 1) was accompanied by the increase of the current in the rock (up
to 30%). The well production increased by 130% after electric treatment was
stopped. Measurements of the well production seven months after the electric
treatment showed that the production rates increased by additional 20%, so that
the total increase in the production reached 150% (or 2.5 times the initial value).
Similar results were obtained for other analogous wells (a total of 11 wells). The
average increase in the production equaled 185%; the range of values was 100 to
200%.
Typical results of the electric treatment of hydrogeological and oil wells are
presented in table 10.1. The drop in the inundation of the oil wells after electric
treatment is due to the development of gas colmatation described in the next
chapter. This effect is reversible and disappears several months after the well has
been treated.