
Page 213 - Percolation Models for Transport in Porous Media With
P. 213
12.5 GAS COLMATATION 211
f
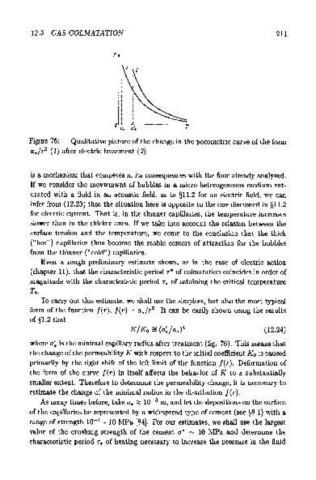
Figure 76: Qualitative picture of the change in the porometric curve of the form
a*fr (1) after electric treatment (2)
2
is a mechanism that competes in its consequences with the four already analyzed.
If we consider the movwmwnt of bubbles in a micro heterogeneous medium sat-
urated with a fluid in an acoustic field, as in §11.2 for an electric field, we can
infer from (12.23) that the situation here is opposite to the one discussed in §11.2
for electric current. That is, in the thinner capillaries, the temperature increases
slower than in the thicker ones. If we take into account the relation between the
surface tension and the temperature, we come to the conclusion that the thick
("hot") capillaries thus become the stable centers of attraction for the bubbles
from the thinner ("cold") capillaries.
Even a rough preliminary estimate shows, as in the case of electric action
(chapter 11), that the characteristic period r* of colmatation coincides in order of
magnitude with the characteristic period r. of attaining the critical temperature
Tk.
To carry out this estimate, we shall use the simplest, but also the most typical
form of the function f(r), f(r) = a*fr 2 • It can be easily shown using the results
of §1.2 that
{12.24)
where a: is the minimal capillary radius after treatment (fig. 76). This means that
the change of the permeability K with respect to the initial coefficient K 0 is caused
primarily by the right shift of the left limit of the function J(r). Deformation of
the form of the curve f(r) in itself affects the behavior of K to a substantially
smaller extent. Therefore to determine the permeability change, it is necessary to
estimate the change of the minimal radius in the distribution J(r).
As many times before, take a*~ 10- 6 m, and let the depositions on the surface
of the capillaries be represented by a widespread type of cement (see §8.1) with a
range of strength 10- 1 - 10 MPa [84]. For our estimates, we shall use the largest
value of the crushing strength of the cement a* ""' 10 MPa and determine the
characteristic period r. of heating necessary to increase the pressure in the fluid