
Page 62 - Percolation Models for Transport in Porous Media With
P. 62
54 CHAPTER 3. PERCOLATION MODEL OF FLUID FLOW
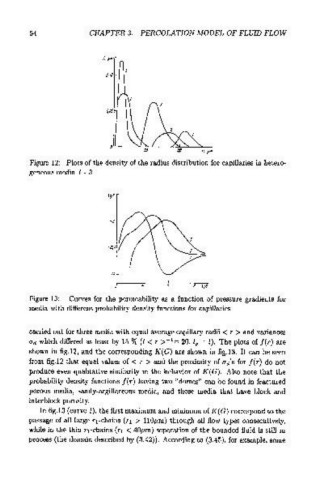
Figure 12: Plots of the density of the radius distribution for capillaries in hetero-
geneous media 1 - 3
LgK
z 5 8 tg8
Figure 13: Curves for the permeability as a function of pressure gradients for
media with different probability density functions for capillaries
carried out for three media with equal average capillary radii < r > and variances
ad which differed at least by 15% (l < r >- 1= 20, lp = l). The plots of f(r) are
shown in fig.l2, and the corresponding K( G) are shown in fig.l3. It can be seen
from fig.l2 that equal values of < r > and the proximity of ad's for f(r) do not
produce even qualitative similarity in the behavior of K(G). Also note that the
probability density functions f(r) having two "domes" can be found in fractured
porous media, sandy-argillaceous media, and those media that have block and
interblock porosity.
In fig.l3 (curve 1), the first maximum and minimum of K(G) correspond to the
passage of all large rrchains (r1 > llO~tm) through all flow types consecutively,
while in the thin r 1-chains (r1 < 40~tm) separation of the bounded fluid is still in
process {the domain described by {3.42)). According to (3.45), for example, some