
Page 63 - Percolation Models for Transport in Porous Media With
P. 63
3.3 RESULTS AND COMPARISON WITH EXPERIMENT 55
~~~~~~----~----~~~--~~----~~sG
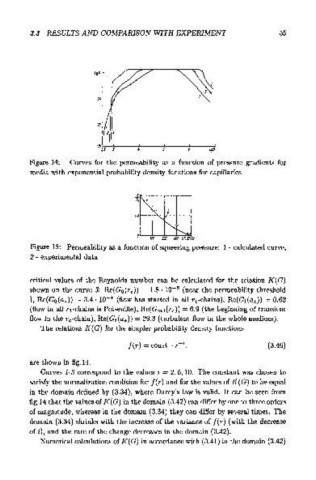
Figure 14: Curves for the permeability as a function of pressure gradients for
media with exponential probability density functions for capillaries
Figure 15: Permeability as a function of squeezing pressure: 1- calculated curve,
2 - experimental data
critical values of the Reynolds number can be calculated for the relation K(G)
shown on the curve 3: Re(G0(rc)) = 1.8 · w- 6 (near the permeability threshold
), Re(Go(a*)) = 3.4. w- 4 (flow has started in all Tt-chains), Re(G,(a*)) = 0.62
(flow in all r 1-chains is Poiseuille), Re(Gml(rc)) = 6.9 (the beginning of transient
flow in the rc-chain), Re(Gt(a*)) = 29.3 (turbulent flow in the whole medium).
The relations K(G) for the simpler probability density functions
f(r) =canst · r-i. (3.46)
are shown in fig.l4.
Curves 1-3 correspond to the values i = 2, 6, 10. The constant was chosen to
satisfy the normalization condition for f(r) and for the values of K(G) to be equal
in the domain defined by (3.34), where Darcy's law is valid. It can be seen from
fig.14 that the values of K( G) in the domain (3.42) can differ by one to three orders
of magnitude, whereas in the domain (3.34) they can differ by several times. The
domain (3.34) shrinks with the increase of the variance of f(r) (with the decrease
of i), and the rate of the change decreases in the domain (3.42).
Numerical calculations of K(G) in accordance with (3.41) in the domain (3.42)