
Page 86 - Percolation Models for Transport in Porous Media With
P. 86
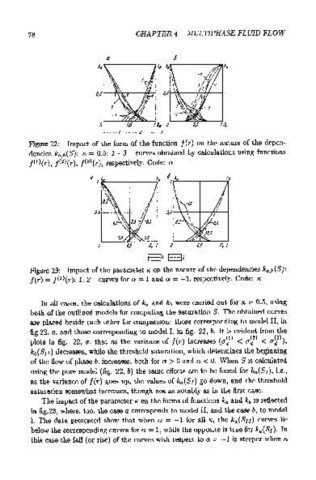
78                            CHAPTER 4.  MULTIPHASE FLUID FLOW


         Figure 22:  Impact of the form  of the function  f(r) on  the nature of the depen-
         dencies  ka,b(S):  K- = 0.5;  1 - 3- curves obtained  by calculations using functions
         j(l>(r), j< 2 >(r),  j< 3 >(r),  respectively.  Code:  a

                          a  1 ,;:.lra~----.,------.k'


                            0
                                          I  lr  1---12
         Figure 23:  Impact of the parameter K- on the nature of the dependencies ka,b(S):
         f(r) = J< 1 >(r);  1,  2- curves for a= 1 and a= -1, respectively.  Code:  K-


            In all cases, the calculations of ka  and kb  were carried out for  K- = 0.5,  using
         both of the outlined models for computing the saturationS.  The obtained curves
         are placed beside each other for comparison:  those corresponding to model II, in
         fig.22, a,  and those corresponding to model I, in fig.  22,  b.  It is evident from  the
                                                                 1
                                                                       2
         plots  in  fig.  22,  a,  that  as  the  variance  of f(r)  increases  (a~ )  < a~ )  < a~ >),
                                                                              3
          kb(Su) decreases, while the threshold saturation, which determines the beginning
         of the flow  of phase b,  increases, both for a  > 0 and a  < 0.  When S  is calculated
          using the pore model  (fig.  22,  b)  the same effects are to be found  for  ka(SI),  i.e.,
          as the variance of f(r) goes up,  the values of ka(SI)  go down,  and the threshold
          saturation somewhat increases, though not as notably as in the first  case.
             The impact of the parameter K- on the forms of functions ka  and kb  is reflected
          in fig.23,  where,  too, the case a corresponds to model II, and the case b,  to model
          I. The data presented show  that  when  a  = -1 for  all  K-,  the  ka (  S  II)  curves lie
          below the corresponding curves for a= 1, while the opposite is true for ka(SI ).  In
          this case the fall  (or rise) of the curves with respect to a= -1 is steeper when  K-