
Page 142 - Performance Leadership
P. 142
Chapter 8 Balancing Performance and Risk • 131
effective message; the risk of getting it wrong is too great. But why look
for just one alternative to reach the new objective? Wouldn’t a portfo-
lio of improvement activities do the trick? The following three steps
will lead to a better way of making the right decisions while address-
ing the associated risks.
1. Determine the risk level and level of ambition. The bank is not a
particularly risk-averse or risk-seeking organization. It offers stan-
dard products to customer masses. However, the bank is very
ambitious. As a result, it chooses a performance/risk matrix with
the marking line in the middle between high and low risk, and
the marking line between high and low performance toward the
high end.
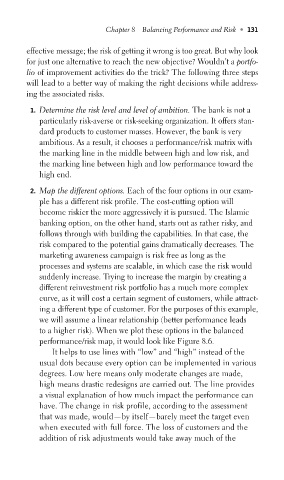
2. Map the different options. Each of the four options in our exam-
ple has a different risk profile. The cost-cutting option will
become riskier the more aggressively it is pursued. The Islamic
banking option, on the other hand, starts out as rather risky, and
follows through with building the capabilities. In that case, the
risk compared to the potential gains dramatically decreases. The
marketing awareness campaign is risk free as long as the
processes and systems are scalable, in which case the risk would
suddenly increase. Trying to increase the margin by creating a
different reinvestment risk portfolio has a much more complex
curve, as it will cost a certain segment of customers, while attract-
ing a different type of customer. For the purposes of this example,
we will assume a linear relationship (better performance leads
to a higher risk). When we plot these options in the balanced
performance/risk map, it would look like Figure 8.6.
It helps to use lines with “low” and “high” instead of the
usual dots because every option can be implemented in various
degrees. Low here means only moderate changes are made,
high means drastic redesigns are carried out. The line provides
a visual explanation of how much impact the performance can
have. The change in risk profile, according to the assessment
that was made, would—by itself—barely meet the target even
when executed with full force. The loss of customers and the
addition of risk adjustments would take away much of the