
Page 139 - Performance Leadership
P. 139
128 • Part II Operational and Analytical Dimensions
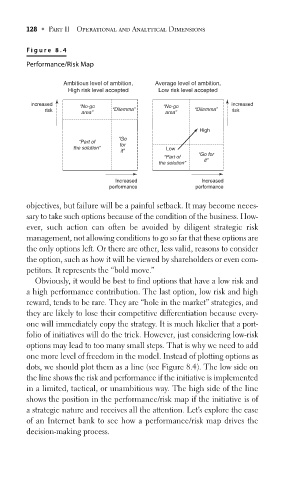
F igur e 8.4
Performance/Risk Map
Ambitious level of ambition, Average level of ambition,
High risk level accepted Low risk level accepted
increased “No-go “No-go increased
risk “Dilemma” “Dilemma” risk
area” area”
High
“Go
“Part of
for
the solution” Low
it”
“Part of “Go for
it”
the solution”
Increased Increased
performance performance
objectives, but failure will be a painful setback. It may become neces-
sary to take such options because of the condition of the business. How-
ever, such action can often be avoided by diligent strategic risk
management, not allowing conditions to go so far that these options are
the only options left. Or there are other, less valid, reasons to consider
the option, such as how it will be viewed by shareholders or even com-
petitors. It represents the “bold move.”
Obviously, it would be best to find options that have a low risk and
a high performance contribution. The last option, low risk and high
reward, tends to be rare. They are “hole in the market” strategies, and
they are likely to lose their competitive differentiation because every-
one will immediately copy the strategy. It is much likelier that a port-
folio of initiatives will do the trick. However, just considering low-risk
options may lead to too many small steps. That is why we need to add
one more level of freedom in the model. Instead of plotting options as
dots, we should plot them as a line (see Figure 8.4). The low side on
the line shows the risk and performance if the initiative is implemented
in a limited, tactical, or unambitious way. The high side of the line
shows the position in the performance/risk map if the initiative is of
a strategic nature and receives all the attention. Let’s explore the case
of an Internet bank to see how a performance/risk map drives the
decision-making process.