
Page 157 - Petroleum Geology
P. 157
134
perature (BHT) is lower than the true bottom-hole temperature because of
the circulation of cooler mud. Once mud circulation stops, heat flow tends
to restore thermal equilibrium. Because this cooling effect is negligible ahead
of the bit while drilling, the significant period for a bottom-hole tempera-
ture determination is the period of circulation after drilling and before
pulling out of the hole for logging.
Dowdle and Cobb (1975) showed that a Horner plot (see p. 174) will lead
to satisfactory approximations to true “formation” temperature for short
circulation times (which were not specified, but may be taken as less than
five hours or so -- but any intelligent estimate may well be better than
none). They assumed that the relationship between true bottom-hole tem-
perature and the measured, perturbed temperature was of the form:
(6.13)
where t, is the temperature measured at the bottom of the hole at time AT
hours after stopping circulation that had been going on for T hours; C is a
constant, and tbh is the true bottom-hole temperature.
A Horner plot makes use of the fact that (T + AT)/AT approaches unity,
and its logarithm zero, as AT increases indefinitely. Thus a linear relationship
was assumed between the measured temperature and the logarithm of the
dimensionless time, and extrapolation of the dimensionless time to zero
gives an estimate of the true bottom-hole temperature if the hole were al-
lowed to approach thermal equilibrium indefinitely.
What is required is:
- The duration of circulation after drilling, before pulling out (T hours)
from properly logged drilling operations.
- The elapsed time (AT hours) from stopping circulation until the sonde
was on the bottom, for each run (i.e., a calibrated maximum-reading ther-
mometer read after each run and recorded on the log heading).
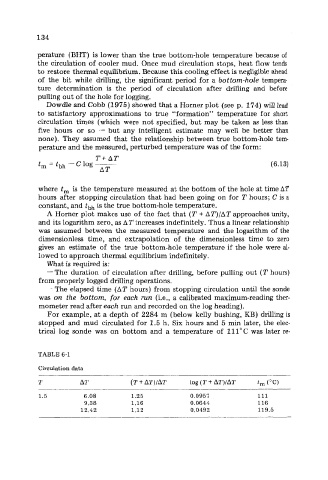
For example, at a depth of 2284 m (below kelly bushing, KB) drilling is
stopped and mud circulated for 1.5 h. Six hours and 5 min later, the elec-
trical log sonde was on bottom and a temperature of 111°C was later re-
TABLE 6-7
Circulation data
T AT (T + AT)/AT log (T + AT)/AT t, (“C)
1.5 6.08 1.25 0.0957 111
9.38 1.16 0.0644 116
12.42 1.12 0.0492 119.5