
Page 158 - Petroleum Geology
P. 158
135
corded. Nine hours and 23 min after stopping circulation, the Sonic log was
on bottom, and a temperature of 116°C was recorded. Twelve hours and
25 min after stopping circulation, a bottom-hole temperature of 119.5"C
was recorded. The data are shown in Table 6-1.
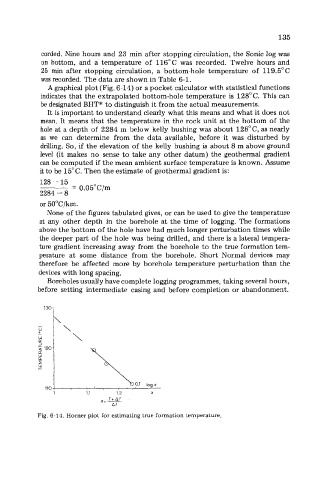
A graphical plot (Fig. 6-14) or a pocket calculator with statistical functions
indicates that the extrapolated bottom-hole temperature is 128" C. This can
be designated BHT* to distinguish it from the actual measurements.
It is important to understand clearly what this means and what it does not
mean. It means that the temperature in the rock unit at the bottom of the
hole at a depth of 2284 m below kelly bushing was about 128"C, as nearly
as we can determine from the data available, before it was disturbed by
drilling. So, if the elevation of the kelly bushing is about 8 m above ground
level (it makes no sense to take any other datum) the geothermal gradient
can be computed if the mean ambient surface temperature is known. Assume
it to be 15°C. Then the estimate of geothermal gradient is:
128 -- 15
= 0.05"C/m
2284 - 8
or 5O"C/km.
None of the figures tabulated gives, or can be used to give the temperature
at any other depth in the borehole at the time of logging. The formations
above the bottom of the hole have had much longer perturbation times while
the deeper part of the hole was being drilled, and there is a lateral tempera-
ture gradient increasing away from the borehole to the true formation tem-
perature at some distance from the borehole. Short Normal devices may
therefore be affected more by borehole temperature perturbation than the
devices with long spacing.
Boreholes usually have complete logging programmes, taking several hours,
before setting intermediate casing and before completion or abandonment.
Fig. 6-14. Horner plot for estimating true formation temperature.