
Page 34 - Petroleum Geology
P. 34
144 60 3 324 288 252 216 180
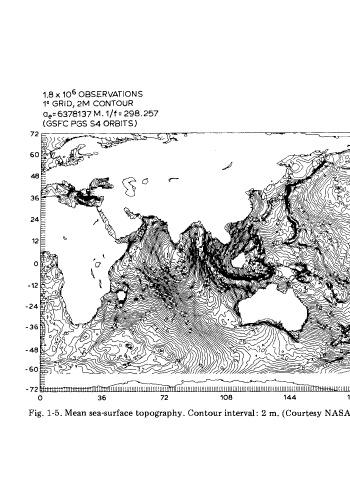
108 Fig. 1-5. Mean sea-surface topography. Contour interval: 2 m. (Courtesy NASA/Goddard Space Flight Center.)
72
298.257
1.8 x lo6 OBSERVATIONS GRID, 2M CONTOUR M. l/f= a,=6378137 (GSFC PGS S4 ORBITS) 36
lo
- 72 a