
Page 81 - Petroleum Geology
P. 81
60
100 150 pslft
I
krn
6=1 0.6 0.2
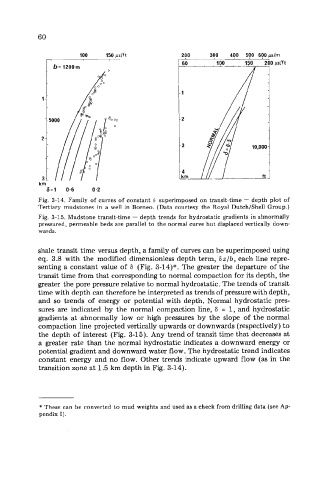
Fig. 3-14. Family of curves of constant 6 superimposed on transit-time - depth plot of
Tertiary mudstones in a well in Borneo. (Data courtesy the Royal Dutch/Shell Group.)
Fig. 3-1 5. Mudstone transit-time - depth trends for hydrostatic gradients in abnormally
pressured, permeable beds are parallel to the normal curve but displaced vertically down-
wards.
shale transit time versus depth, a family of curves can be superimposed using
eq. 3.8 with the modified dimensionless depth term, 6z/b, each line repre-
senting a constant value of 6 (Fig. 3-14)". The greater the departure of the
transit time from that corresponding to normal compaction for its depth, the
greater the pore pressure relative to normal hydrostatic. The trends of transit
time with depth can therefore be interpreted as trends of pressure with depth,
and so trends of energy or potential with depth. Normal hydrostatic pres-
sures are indicated by the normal compaction line, 6 = 1, and hydrostatic
gradients at abnormally low or high pressures by the slope of the normal
compaction line projected vertically upwards or downwards (respectively) to
the depth of interest (Fig. 3-15). Any trend of transit time that decreases at
a greater rate than the normal hydrostatic indicates a downward energy or
potential gradient and downward water flow. The hydrostatic trend indicates
constant energy and no flow. Other trends indicate upward flow (as in the
transition zone at 1.5 km depth in Fig. 3-14).
* These can be converted to mud weights and used as a check from drilling data (see Ap-
pendix I).