
Page 143 - Petrophysics 2E
P. 143
1 16 PETROPHYSICS: RESERVOIR ROCK PROPERTIES
IO
1
7
0.1
J, = KT4.5
0.01
0.001 0.01 0.1 1
Water Saturation, Fraction
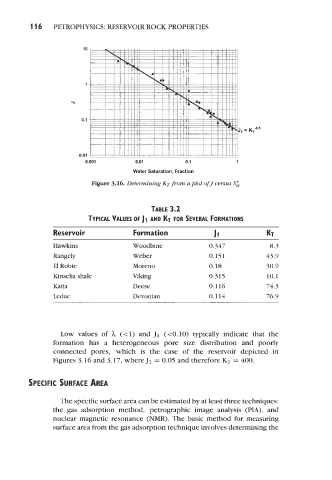
Figure 3.16. Determining KT from a plot of J versus S&
TABLE 3.2
TYPICAL VALUES OF 11 AND KT FOR SEVERAL FORMATIONS
Reservoir Formation 11 KT
Hawkins Woodbine 0.347 8.3
RWFlY Weber 0.151 43.9
El Robie Moreno 0.18 30.9
Kinselia shale Viking 0.315 10.1
Katia Deese 0.116 74.3
Leduc Devonian 0.114 76.9
Low values of h ((1) and J1 (tO.10) typically indicate that the
formation has a heterogeneous pore size distribution and poorly
connected pores, which is the case of the reservoir depicted in
Figures 3.16 and 3.17, where J1 = 0.05 and therefore KT = 400.
SPECIFIC SURFACE AREA
The specific surface area can be estimated by at least three techniques:
the gas adsorption method, petrographic image analysis (PIA), and
nuclear magnetic resonance (NMR). The basic method for measuring
surface area from the gas adsorption technique involves determining the