
Page 144 - Petrophysics 2E
P. 144
PERMEABILITY-POROSITY RELATIONSHIPS 117
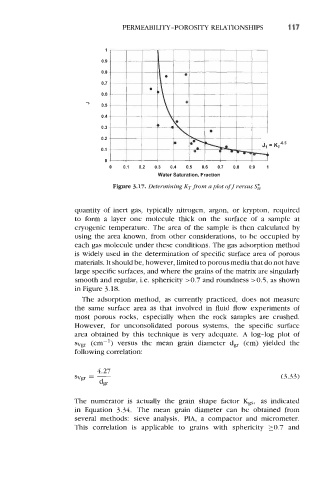
0 0.1 0.2 0.3 0.4 0.5 0.6 0.7 0.8 0.9 1
Water Saturation, Fraction
Figure 3.17. Determining KT from a plot of J versus S&
quantity of inert gas, typically nitrogen, argon, or krypton, required
to form a layer one molecule thick on the surface of a sample at
cryogenic temperature. The area of the sample is then calculated by
using the area known, from other considerations, to be occupied by
each gas molecule under these conditions. The gas adsorption method
is widely used in the determination of specific surface area of porous
materials. It should be, however, limited to porous media that do not have
large specific surfaces, and where the grains of the matrix are singularly
smooth and regular, i.e. sphericity >0.7 and roundness >OS, as shown
in Figure 3.18.
The adsorption method, as currently practiced, does not measure
the same surface area as that involved in fluid flow experiments of
most porous rocks, especially when the rock samples are crushed.
However, for unconsolidated porous systems, the specific surface
area obtained by this technique is very adequate. A log-log plot of
SV, (cm-') versus the mean grain diameter d, (cm) yielded the
following correlation:
4.27
sv, = - (3.33)
dgr
The numerator is actually the grain shape factor Kgs, as indicated
in Equation 3.34. The mean grain diameter can be obtained from
several methods: sieve analysis, PIA, a compactor and micrometer.
This correlation is applicable to grains with sphericity 10.7 and