Page 172 - Petrophysics 2E
P. 172

PERMEABILITY-POROSITY RELATIONSHIPS              145
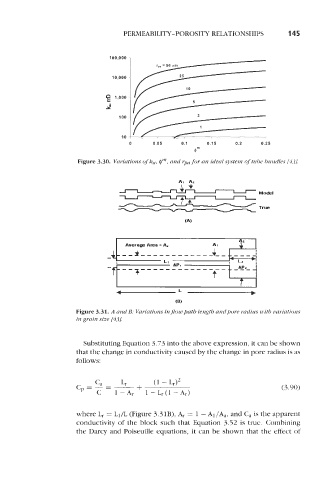

                                  100,000


                                   10.000


                                   1.000
                                 22
                                     100


                                     10
                                        0      0.05    0.1     0.15     0.2    0.25
                                                           tJm
                        Figure 3.30. Variations of ka, Qm,  and rpa for an ideal system of  tube bundles [43].


                                    4                  L                    b
                                                      (B)
                        Figure 3.31. A and B: Variations inflowpath length andpore radius with variations
                        in grain size [43].


                          Substituting Equation 3.73 into the above expression, it can be shown
                        that the change in conductivity caused by the change in pore radius is as
                        follows:


                                                                                     (3.90)


                        where    = L1/L (Figure 3.3 1 B),  Ar  = 1 - A1 /Aa,  and Ca  is the apparent
                        conductivity of  the block such that Equation 3.52 is true.  Combining
                        the Darcy and Poiseuille equations, it can be shown that the effect of
   167   168   169   170   171   172   173   174   175   176   177