
Page 405 - Petrophysics 2E
P. 405
EVALUATION OF WETTABILITY 373
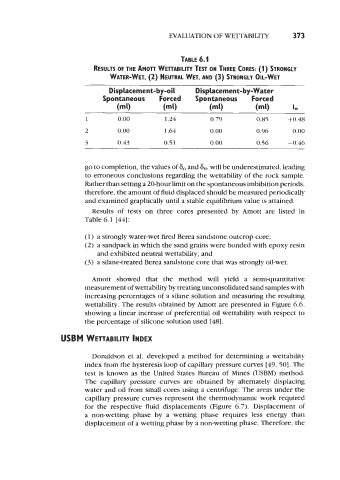
TABLE 6.1
RESULTS OF THE AHO~ WETTABlLlTY TEST ON THREE CORES: (1) STRONGLY
WATER-WET, (2) NEUTRAL WET, AND (3) STRONGLY OIL-WET
Displacement-by-oil Displacement-by-Water
Spontaneous Forced Spontaneous Forced
(mu (m') (ml) (ml) 1,
1 0.00 1.24 0.79 0.85 +0.48
2 0.00 1.64 0.00 0.96 0.00
3 0.43 0.51 0.00 0.56 -0.46
go to completion, the values of 6, and S, will be underestimated, leading
to erroneous conclusions regarding the wettability of the rock sample.
Rather than setting a 20-hour limit on the spontaneous imbibition periods,
therefore, the amount of fluid displaced should be measured periodically
and examined graphically until a stable equilibrium value is attained.
Results of tests on three cores presented by Amott are listed in
Table 6.1 [44]:
(1) a strongly water-wet fired Berea sandstone outcrop core;
(2) a sandpack in which the sand grains were bonded with epoxy resin
and exhibited neutral wettability; and
(3) a silane-treated Berea sandstone core that was strongly oil-wet.
Amott showed that the method will yield a semi-quantitative
measurement of wettability by treating unconsolidated sand samples with
increasing percentages of a silane solution and measuring the resulting
wettability. The results obtained by Amott are presented in Figure 6.6,
showing a linear increase of preferential oil wettability with respect to
the percentage of silicone solution used [48].
USBM W ETTABILITY INDEX
Donaldson et al. developed a method for determining a wettability
index from the hysteresis loop of capillary pressure curves [49, 501. The
test is known as the United States Bureau of Mines (USBM) method.
The capillary pressure curves are obtained by alternately displacing
water and oil from small cores using a centrifuge. The areas under the
capillary pressure curves represent the thermodynamic work required
for the respective fluid displacements (Figure 6.7). Displacement of
a non-wetting phase by a wetting phase requires less energy than
displacement of a wetting phase by a non-wetting phase. Therefore, the