
Page 204 - Petrophysics
P. 204
PERMEABILITY-POROSITY RELATIONSHIPS 177
0.01 0.1 1 5 10 20 50 80 90 95 99 99.9 99.99
Cumulative frequency, %
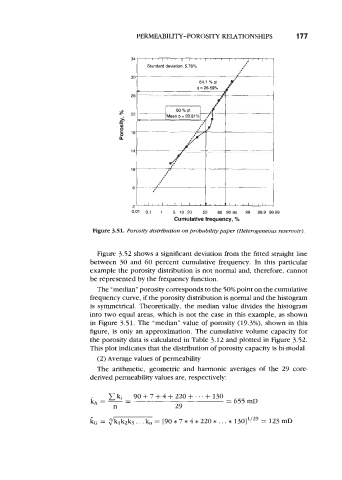
Figure 3.51. Porosity distribution on probability paper (Heterogeneous reservoir).
Figure 3.52 shows a significant deviation from the fitted straight line
between 30 and 60 percent cumulative frequency. In this particular
example the porosity distribution is not normal and, therefore, cannot
be represented by the frequency function.
The ”median” porosity corresponds to the 50% point on the cumulative
frequency curve, if the porosity distribution is normal and the histogram
is symmetrical. Theoretically, the median value divides the histogram
into two equal areas, which is not the case in this example, as shown
in Figure 3.51. The “median” value of porosity (19.3%), shown in this
figure, is only an approximation. The cumulative volume capacity for
the porosity data is calculated in Table 3.12 and plotted in Figure 3.52.
This plot indicates that the distribution of porosity capacity is bi-modal.
(2) Average values of permeability
The arithmetic, geometric and harmonic averages of the 29 core-
derived permeability values are, respectively:
- Cki 90+7+4+220+...+130
-
-
kA = - = 655 mD
n 29