Page 210 - Petrophysics
P. 210

PERMEAFHLITY-POROSITY REIATIONSHIPS              183


                            following equation is used to calculate permeability:


                                     WBo
                            k = 162.6-                                                  (3.130)
                                      mh


                            where:  k  = formation permeability, mD
                                    q  = flow rate, STB/D
                                    m  = fluid viscosity, CP
                                    Bo = formation volume factor, bbl/STB
                                    h  = formation thickness
                                    m  = slope of the straight line, psiflog cycle

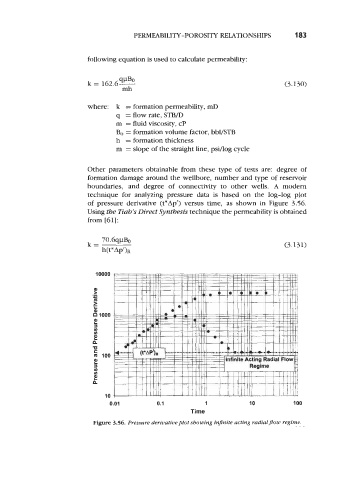
                            Other parameters obtainable from  these type  of  tests  are:  degree of
                            formation damage around the wellbore, number and type of  reservoir
                            boundaries,  and  degree  of  connectivity to  other  wells.  A  modern
                            technique for  analyzing pressure data  is  based  on  the  log-log  plot
                            of  pressure derivative (t*Ap’)  versus time,  as  shown in Figure 3.56.
                            Using the Tiub’s Direct Synthesis technique the permeability is obtained
                            from [61]:


                              10000
                              al
                             .-
                              >
                             U
                             .-
                              Q
                              >
                             :
                              L
                               1000
                              2
                              3
                              u)
                              u)
                              2
                             n
                             m
                                100
                              2
                              a
                              u)
                              u)
                              2
                             n
                                 10
                                   0.01          0.1            1            10           100
                                                           Time
                              Figure 3.56. Pressure derivative plot showing infinite acting radialpow regime.
   205   206   207   208   209   210   211   212   213   214   215