
Page 431 - Petrophysics
P. 431
EFFECT OF WETTABILITY ON ELECTRICAL PROPERTIES 399
.1 .2 -4 .6 -81 D
BRINE SATURATION
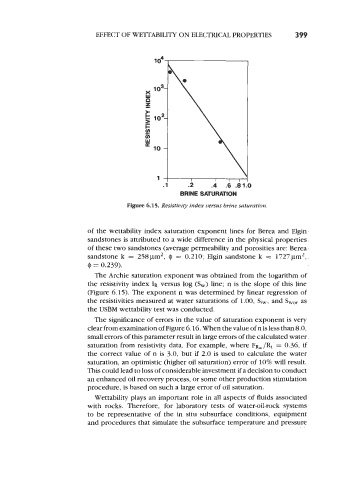
Figure 6.15. Resistivity index versus brine saturation.
of the wettability index saturation exponent lines for Berea ant Elgin
sandstones is attributed to a wide difference in the physical properties
of these two sandstones (average permeability and porosities are: Berea
sandstone k = 258pm2, 0 = 0.210; Elgin sandstone k = 1727pm2,
0 = 0.239).
The Archie saturation exponent was obtained from the logarithm of
the resistivity index IR versus log (&) line; n is the slope of this line
(Figure 6.15). The exponent n was determined by linear regression of
the resistivities measured at water saturations of 1.00, Siw, and S,,, as
the USBM wettability test was conducted.
The significance of errors in the value of saturation exponent is very
clear from examination of Figure 6.16. When the value of n is less than 8.0,
small errors of this parameter result in large errors of the calculated water
saturation from resistivity data. For example, where FR,/R~ = 0.36, if
the correct value of n is 3.0, but if 2.0 is used to calculate the water
saturation, an optimistic (higher oil saturation) error of 10% will result.
This could lead to loss of considerable investment if a decision to conduct
an enhanced oil recovery process, or some other production stimulation
procedure, is based on such a large error of oil saturation.
Wettability plays an important role in all aspects of fluids associated
with rocks. Therefore, for laboratory tests of water-oil-rock systems
to be representative of the in situ subsurface conditions, equipment
and procedures that simulate the subsurface temperature and pressure