
Page 504 - Petrophysics
P. 504
472 PETROPHYSICS: RESERVOIR ROCK PROPERTIES
PERMEABILITY- md
250 200 150 100 50 0
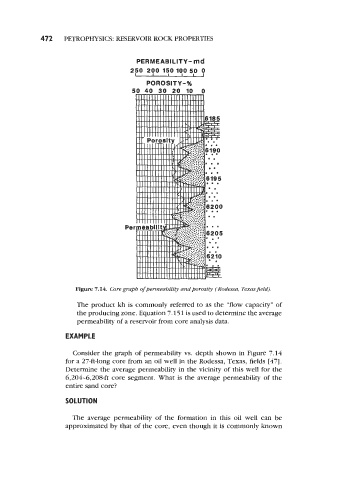
Figure 7.14. Core graph of permeability and porosity (Rodessa, Texus field).
The product kh is commonly referred to as the “flow capacity” of
the producing zone. Equation 7.15 1 is used to determine the average
permeability of a reservoir from core analysis data.
EXAMPLE
Consider the graph of permeability vs. depth shown in Figure 7.14
for a 27-ft-long core from an oil well in the Rodessa, Texas, fields [47].
Determine the average permeability in the vicinity of this well for the
6,204-6,208-ft core segment. What is the average permeability of the
entire sand core?
SOLUTION
The average permeability of the formation in this oil well can be
approximated by that of the core, even though it is commonly known