
Page 577 - Petrophysics
P. 577
544 PETROPHYSICS: RESERVOIR ROCK PROPERTIES
An interference test yielded an average reservoir permeability, which
implies that fractures are uniformly distributed. The total storativity,
(+ct)m+f = 1.4 x lop6 psiw1, was obtained from this interference test.
Only the porosity, Permeability and compressibility of the matrix could
be determined from the recovered cores.
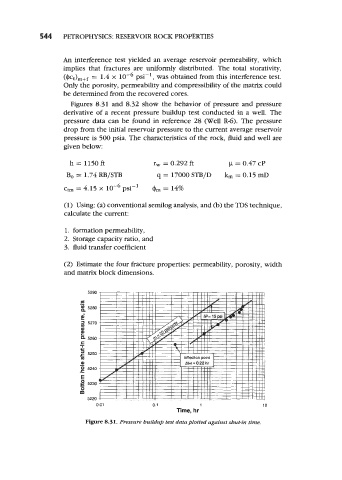
Figures 8.31 and 8.32 show the behavior of pressure and pressure
derivative of a recent pressure buildup test conducted in a well. The
pressure data can be found in reference 28 (Well R-6). The pressure
drop from the initial reservoir pressure to the current average reservoir
pressure is 500 psia. The characteristics of the rock, fluid and well are
given below:
h = l150fi r, = 0.292 ft p = 0.47 CP
Bo = 1.74 RB/STB q = 17000 STB/D k, = 0.15 mD
ctm = 4.15 x 10- 6 psi-’ qrn = 14%
(1) Using: (a) conventional semilog analysis, and (b) the TDS technique,
calculate the current:
1. formation permeability,
2. Storage capacity ratio, and
3. fluid transfer coefficient
(2) Estimate the four fracture properties: permeability, porosity, width
and matrix block dimensions.
5290
.-
(P
5280
P
3 5270
fn
fn
E
a 5260
.-
C
w
2 5250
-
u)
a
0 5240
c
1 5230
m
5220
0.01 0.1 1 10
Time, hr
Figure 8.31. Pressure buildup test data plotted against shut-in time.