
Page 572 - Petrophysics
P. 572
CHARACTERIZING NATURAL FRACTURES 539
The fracture compressibility can be estimated from the following
expression [22]:
1 - (kf/kfi)”3
Cf = (8.77)
AP
kfi = Fracture permeability at the initial reservoir pressure pj
kf = Fracture permeability at the current average reservoir pressure p
In deep naturally fractured reservoirs, fractures and the stress axis on the
formation generally are vertically oriented. Thus when the pressure drops
due to reservoir depletion, the fracture permeability reduces at a lower
rate than one would expect, as indicated by Equation 8.77. In Type-2
naturally fractured reservoirs, where matrix porosity is much greater
than fracture porosity, as the reservoir pressure drops the matrix porosity
decreases in favor of fracture porosity [22]. This not the case in Type-1
naturally fractured reservoirs, particularly if the matrix porosity is very
low.
A representative average value of the effective permeability of a
naturally hctured reservoir may be obtained from:
where
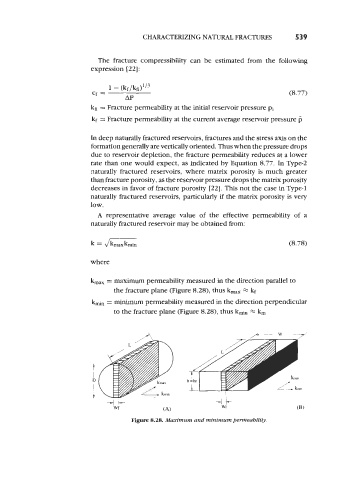
k,, = maximum permeability measured in the direction parallel to
the fracture plane (Figure 8.28), thus kmm X kf
kmin = minimum permeability measured in the direction perpendicular
to the fracture plane (Figure 8.28), thus k- km
f
D
I
t
-41-
Wf
Figure 8.28. Maximum and minimum permeability