
Page 383 - Phase Space Optics Fundamentals and Applications
P. 383
364 Chapter Eleven
Pulse
Delay
line (τ) under test
Lens
OSA (ω) Electronics OSA (ω)
and
Nonlinear
crystal modulator
Pulse
under test Phase shifter (τ)
(a) (c)
ω ω ω ω
τ τ τ τ
(b) (d)
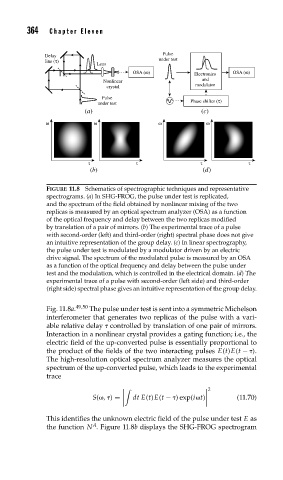
FIGURE 11.8 Schematics of spectrographic techniques and representative
spectrograms. (a) In SHG-FROG, the pulse under test is replicated,
and the spectrum of the field obtained by nonlinear mixing of the two
replicas is measured by an optical spectrum analyzer (OSA) as a function
of the optical frequency and delay between the two replicas modified
by translation of a pair of mirrors. (b) The experimental trace of a pulse
with second-order (left) and third-order (right) spectral phase does not give
an intuitive representation of the group delay. (c) In linear spectrography,
the pulse under test is modulated by a modulator driven by an electric
drive signal. The spectrum of the modulated pulse is measured by an OSA
as a function of the optical frequency and delay between the pulse under
test and the modulation, which is controlled in the electrical domain. (d) The
experimental trace of a pulse with second-order (left side) and third-order
(right side) spectral phase gives an intuitive representation of the group delay.
Fig. 11.8a. 49,50 The pulse under test is sent into a symmetric Michelson
interferometer that generates two replicas of the pulse with a vari-
able relative delay controlled by translation of one pair of mirrors.
Interaction in a nonlinear crystal provides a gating function; i.e., the
electric field of the up-converted pulse is essentially proportional to
the product of the fields of the two interacting pulses E(t)E(t − ).
The high-resolution optical spectrum analyzer measures the optical
spectrum of the up-converted pulse, which leads to the experimental
trace
2
S( , ) = dt E(t)E(t − ) exp(i t) (11.70)
This identifies the unknown electric field of the pulse under test E as
A
the function N . Figure 11.8b displays the SHG-FROG spectrogram