
Page 110 - Physical Principles of Sedimentary Basin Analysis
P. 110
92 Compressibility of rocks and sediments
0 0.5
0.4
50
depth [m] 100 porosity [−] 0.3
0.2
150
0.1
200 0.0
0.0 0.1 0.2 0.3 0.4 0.5 0.0 0.5 1.0 1.5
porosity [−] effective vertical stress [MPa]
(a) (b)
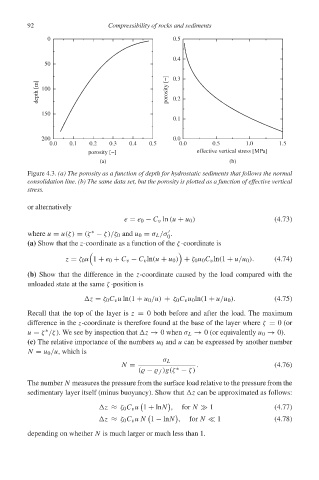
Figure 4.3. (a) The porosity as a function of depth for hydrostatic sediments that follows the normal
consolidation line. (b) The same data set, but the porosity is plotted as a function of effective vertical
stress.
or alternatively
e = e 0 − C v ln (u + u 0 ) (4.73)
∗
where u = u(ζ) = (ζ − ζ)/ζ 0 and u 0 = σ L /σ .
0
(a) Show that the z-coordinate as a function of the ζ-coordinate is
z = ζ 0 u 1 + e 0 + C v − C v ln(u + u 0 ) + ζ 0 u 0 C v ln(1 + u/u 0 ). (4.74)
(b) Show that the difference in the z-coordinate caused by the load compared with the
unloaded state at the same ζ-position is
z = ζ 0 C v u ln(1 + u 0 /u) + ζ 0 C v u 0 ln(1 + u/u 0 ). (4.75)
Recall that the top of the layer is z = 0 both before and after the load. The maximum
difference in the z-coordinate is therefore found at the base of the layer where ζ = 0(or
∗
u = ζ /ζ). We see by inspection that z → 0 when σ L → 0 (or equivalently u 0 → 0).
(c) The relative importance of the numbers u 0 and u can be expressed by another number
N = u 0 /u, which is
σ L
N = . (4.76)
∗
( − f )g(ζ − ζ)
The number N measures the pressure from the surface load relative to the pressure from the
sedimentary layer itself (minus buoyancy). Show that z can be approximated as follows:
z ≈ ζ 0 C v u 1 + lnN , for N
1 (4.77)
z ≈ ζ 0 C v uN 1 − lnN , for N
1 (4.78)
depending on whether N is much larger or much less than 1.