
Page 23 - Physical Principles of Sedimentary Basin Analysis
P. 23
2.1 Porosity 5
Table 2.1. Porosity–depth data
for lithologies in the North Sea
from Sclater and Christie (1980).
z 0
Lithology φ 0 [m]
Shale 0.63 1960
Sand 0.49 3703
Chalk 0.70 1408
Shaly sandstone 0.56 2464
0
Chalk
1
ShaleHH
Shale
Shale
2
depth [km] 3 Sandstone
Shaly sandstone
4
5
0.0 0.2 0.4 0.6 0.8
porosity [−]
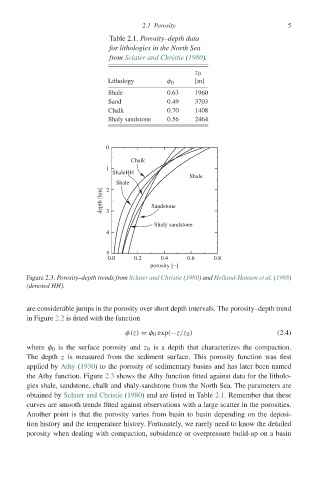
Figure 2.3. Porosity–depth trends from Sclater and Christie (1980) and Helland-Hansen et al. (1988)
(denoted HH).
are considerable jumps in the porosity over short depth intervals. The porosity–depth trend
in Figure 2.2 is fitted with the function
φ(z) = φ 0 exp(−z/z 0 ) (2.4)
where φ 0 is the surface porosity and z 0 is a depth that characterizes the compaction.
The depth z is measured from the sediment surface. This porosity function was first
applied by Athy (1930) to the porosity of sedimentary basins and has later been named
the Athy function. Figure 2.3 shows the Athy function fitted against data for the litholo-
gies shale, sandstone, chalk and shaly-sandstone from the North Sea. The parameters are
obtained by Sclater and Christie (1980) and are listed in Table 2.1. Remember that these
curves are smooth trends fitted against observations with a large scatter in the porosities.
Another point is that the porosity varies from basin to basin depending on the deposi-
tion history and the temperature history. Fortunately, we rarely need to know the detailed
porosity when dealing with compaction, subsidence or overpressure build-up on a basin