
Page 37 - Physical chemistry understanding our chemical world
P. 37
4 INTRODUCTION TO PHYSICAL CHEMISTRY
Relationships and graphs
Physical chemists often depict relationships between variables by
The x-axis (horizontal) drawing graphs. The controlled variable is always drawn along the
is sometimes called x-axis, and the observed variable is drawn up the y-axis.
the abscissa and the
y-axis (vertical) is the Figure 1.1 shows several graphs, each demonstrating a different
ordinate.A simple way kind of relationship. Graph (a) is straight line passing through the
to remember which origin. This graph says: when we vary the controlled variable x,
axis is which is to say, the observed variable y changes in direct proportion. An obvious
‘an eXpanse of road example in such a case is the colour intensity in a glass of black-
goes horizontally along currant cordial: the intensity increases in linear proportion to the
the x-axis’, and ‘a Yo- concentration of the cordial, according to the Beer–Lambert law
Yo goes up and down (see Chapter 9). Graph (a) in Figure 1.1 goes through the origin
the y-axis’. because there is no purple colour when there is no cordial (its
concentration is zero).
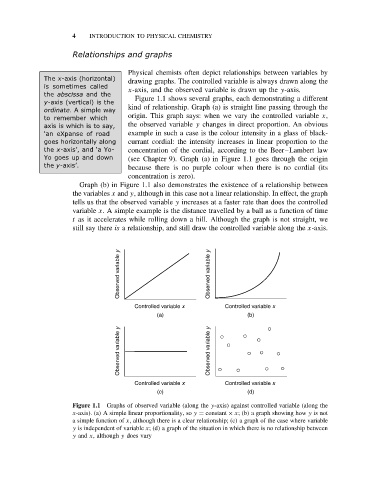
Graph (b) in Figure 1.1 also demonstrates the existence of a relationship between
the variables x and y, although in this case not a linear relationship. In effect, the graph
tells us that the observed variable y increases at a faster rate than does the controlled
variable x. A simple example is the distance travelled by a ball as a function of time
t as it accelerates while rolling down a hill. Although the graph is not straight, we
still say there is a relationship, and still draw the controlled variable along the x-axis.
Observed variable y Observed variable y
Controlled variable x Controlled variable x
(a) (b)
Observed variable y Observed variable y
Controlled variable x Controlled variable x
(c) (d)
Figure 1.1 Graphs of observed variable (along the y-axis) against controlled variable (along the
x-axis). (a) A simple linear proportionality, so y = constant × x; (b) a graph showing how y is not
a simple function of x, although there is a clear relationship; (c) a graph of the case where variable
y is independent of variable x; (d) a graph of the situation in which there is no relationship between
y and x, although y does vary