
Page 47 - Physical chemistry eng
P. 47
24 CHAPTER 2 Heat, Work, Internal Energy, Enthalpy, and the First Law of Thermodynamics
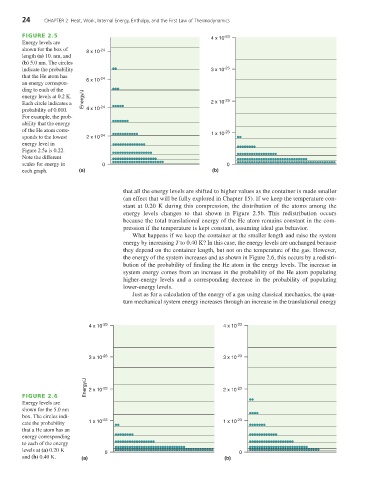
FIGURE 2.5 -23
4 x 10
Energy levels are
shown for the box of -24
8 x 10
length (a) 10. nm, and
(b) 5.0 nm. The circles
indicate the probability 3 x 10 -23
that the He atom has
6 x 10 -24
an energy correspon-
ding to each of the
energy levels at 0.2 K. Energy/J
Each circle indicates a 2 x 10 -23
probability of 0.010. 4 x 10 -24
For example, the prob-
ability that the energy
of the He atom corre- 1 x 10 -23
sponds to the lowest 2 x 10 -24
energy level in
Figure 2.5a is 0.22.
Note the different
scales for energy in 0 0
each graph. (a) (b)
that all the energy levels are shifted to higher values as the container is made smaller
(an effect that will be fully explored in Chapter 15). If we keep the temperature con-
stant at 0.20 K during this compression, the distribution of the atoms among the
energy levels changes to that shown in Figure 2.5b. This redistribution occurs
because the total translational energy of the He atom remains constant in the com-
pression if the temperature is kept constant, assuming ideal gas behavior.
What happens if we keep the container at the smaller length and raise the system
energy by increasing T to 0.40 K? In this case, the energy levels are unchanged because
they depend on the container length, but not on the temperature of the gas. However,
the energy of the system increases and as shown in Figure 2.6, this occurs by a redistri-
bution of the probability of finding the He atom in the energy levels. The increase in
system energy comes from an increase in the probability of the He atom populating
higher-energy levels and a corresponding decrease in the probability of populating
lower-energy levels.
Just as for a calculation of the energy of a gas using classical mechanics, the quan-
tum mechanical system energy increases through an increase in the translational energy
4 x 10 -23 4 x 10 -23
3 x 10 -23 3 x 10 -23
Energy/J 2 x 10 -23 2 x 10 -23
FIGURE 2.6
Energy levels are
shown for the 5.0 nm
box. The circles indi-
cate the probability 1 x 10 -23 1 x 10 -23
that a He atom has an
energy corresponding
to each of the energy
levels at (a) 0.20 K
0 0
and (b) 0.40 K. (a) (b)