Page 179 - Physical Chemistry
P. 179

lev38627_ch05.qxd  3/3/08  4:45 PM  Page 160


                160
               Chapter 5                       From Fig. 5.9, the integral of C d ln T for the gas from 263.1 to 298.15 K
                                                                          P
               Standard Thermodynamic       is the product of 10 cal/(mol K) and ln 298.15   ln 263.1   0.125. This integral
               Functions of Reaction
                                            equals 1.2 cal/(mol K). [Accurate evaluation gives 1.22 cal/(mol K).]
                                                    5
                                               So far, we have gone from the solid at 0 K and 1 atm to the real gas at 298.15 K
                                            and 1 atm. We next add in the given value S m,id    S m,re    0.07 cal/(mol K) to
                                            reach the ideal gas at 298.15 K and 1 atm. The final step is to include  S for
                                                                                                           m
                                            changing the ideal gas from 1 atm to 1 bar at 298.15 K. For an isothermal ideal-
                                            gas process, Eq. (3.30) and Boyle’s law give  S   R ln (V /V )   R ln (P /P ).
                                                                                                1
                                                                                              2
                                                                                    m
                                                                                                          1
                                                                                                             2
                                            The  S for going from 1 atm to 1 bar ( 750 torr) is thus R ln (760/750)
                                                  m
                                            0.03 cal/(mol K).
                      Sº m,298
                                               Adding everything, we get
                                           S° m,298
                                                 10.28   20#   8.95   6.0   22.65   1.2   0.07   0.032 cal>1mol K2
                                                                                     5
                                                           6
                                              S° m,298    59#  cal>1mol K2
                                                     8
                                            [The accurate values give S°    59.28 cal/(mol K)   248.0 J/(mol K).]
                                                                   m,298
                                            Exercise
                                                                                                            1
                                            Use Fig. 5.9 to estimate S°    S°  for SO (s). (Answer: 11 cal mol  1  K .)
                                                                 m,148   m,55     2
                                             Figure 5.10 plots some conventional S°  values. The Appendix tabulates S°
                                                                             m,298                            m,298
                                         for various substances. Diamond has the lowest  S°  of any substance. The
                                                                                        m,298
                                         Appendix S°   values show that (a) molar entropies of gases tend to be higher than
                                                   m,298
                                         those of liquids; (b) molar entropies of liquids tend to be higher than those of solids;
                                         (c) molar entropies tend to increase with increasing number of atoms in a molecule.
                                             Conventional entropies are often called absolute entropies. However, this name is
                                         inappropriate in that these entropies are not absolute entropies but relative (conven-
                                         tional) entropies. Since full consideration of this question requires statistical mechan-
                                         ics, we postpone its discussion until Sec. 21.9.
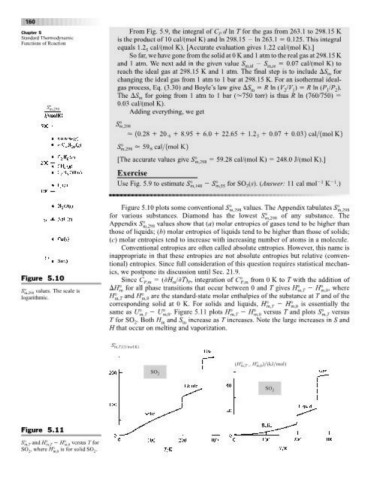
               Figure 5.10                   Since C    ( H / T) , integration of C°  from 0 K to T with the addition of
                                                    P,m     m    P               P,m
                                          H° for all phase transitions that occur between 0 and T gives H°    H° , where
               S° m,298  values. The scale is  m                                                  m,T    m,0
               logarithmic.              H° m,T  and H° are the standard-state molar enthalpies of the substance at T and of the
                                                   m,0
                                         corresponding solid at 0 K. For solids and liquids,  H°    H°  is essentially the
                                                                                        m,T     m,0
                                         same as U°    U° . Figure 5.11 plots H°    H°  versus T and plots S°  versus
                                                  m,T    m,0                 m,T     m,0                 m,T
                                         T for SO . Both H and S increase as T increases. Note the large increases in S and
                                                 2       m     m
                                         H that occur on melting and vaporization.
                                          S° m,T (J mol K)

                                                                               (H° m,T    H° ) (kJ mol)
                                                                                     m,0
                                                      SO 2

                                                                                        SO 2


               Figure 5.11

               S° and H°   H° versus T for
                            m,0
                m,T
                      m,T
               SO , where H° is for solid SO .
                        m,0
                                     2
                 2
   174   175   176   177   178   179   180   181   182   183   184