
Page 213 - Physical Chemistry
P. 213
lev38627_ch06.qxd 3/3/08 10:07 AM Page 194
194
Chapter 6 We will now change the pressure to 0.1 bar and redo the calculation. Enter 0.1 in
Reaction Equilibrium in Ideal Gas cell G2. Note that this changes the value in cell G8, whose formula (Fig. 6.9b) depends
Mixtures
on G2, and changes the values in F11, F12, G11, and G12. Now choose Solver from
the Tools menu (or the Data tab in Excel 2007) and click on Solve. The Solver then
n/mol gives the solution at the new pressure. We can copy and paste this solution into B16
to G16. After a few more runs, we have a table of composition data versus P that can
8
be graphed.
7 To make the graph, first select the block of data to be graphed by dragging with
the mouse. Then choose Chart from the Insert menu or click on the Chart button on
6 n tot the toolbar. In the series of boxes that follow, choose XY (Scatter) as the chart type,
data points connected by smoothed lines as the subtype, and Series in Columns. (In
5
Excel 2007, after selecting the data, click on the Insert tab, then click on Scatter;
then click on the graph subtype for data points connected by smoothed lines.)
4 H2
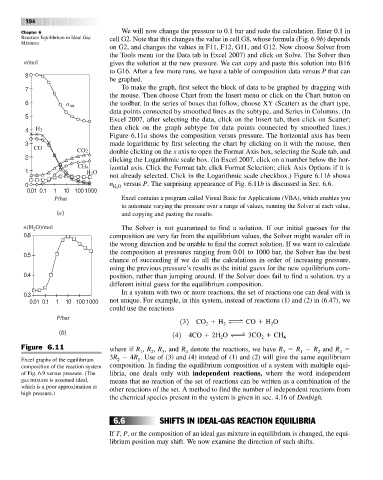
Figure 6.11a shows the composition versus pressure. The horizontal axis has been
3 made logarithmic by first selecting the chart by clicking on it with the mouse, then
CO
CO2 double clicking on the x axis to open the Format Axis box, selecting the Scale tab, and
2 clicking the Logarithmic scale box. (In Excel 2007, click on a number below the hor-
CH4 izontal axis. Click the Format tab; click Format Selection; click Axis Options if it is
1 H2O
not already selected. Click in the Logarithmic scale checkbox.) Figure 6.11b shows
0 n H 2 O versus P. The surprising appearance of Fig. 6.11b is discussed in Sec. 6.6.
0.01 0.1 1 10 1001000
P/bar Excel contains a program called Visual Basic for Applications (VBA), which enables you
to automate varying the pressure over a range of values, running the Solver at each value,
(a) and copying and pasting the results.
n(H O)/mol The Solver is not guaranteed to find a solution. If our initial guesses for the
2
0.6 composition are very far from the equilibrium values, the Solver might wander off in
the wrong direction and be unable to find the correct solution. If we want to calculate
the composition at pressures ranging from 0.01 to 1000 bar, the Solver has the best
0.5
chance of succeeding if we do all the calculations in order of increasing pressure,
using the previous pressure’s results as the initial guess for the new equilibrium com-
0.4 position, rather than jumping around. If the Solver does fail to find a solution, try a
different initial guess for the equilibrium composition.
In a system with two or more reactions, the set of reactions one can deal with is
0.3
0.01 0.1 1 10 100 1000 not unique. For example, in this system, instead of reactions (1) and (2) in (6.47), we
could use the reactions
P/bar
132 CO H ∆ CO H O
2
2
2
(b)
142 4CO 2H O ∆ 3CO CH 4
2
2
Figure 6.11 where if R , R , R , and R denote the reactions, we have R R R and R
3
2
4
3
1
4
2
1
3R 4R . Use of (3) and (4) instead of (1) and (2) will give the same equilibrium
Excel graphs of the equilibrium 2 1
composition of the reaction system composition. In finding the equilibrium composition of a system with multiple equi-
of Fig. 6.9 versus pressure. (The libria, one deals only with independent reactions, where the word independent
gas mixture is assumed ideal, means that no reaction of the set of reactions can be written as a combination of the
which is a poor approximation at other reactions of the set. A method to find the number of independent reactions from
high pressure.)
the chemical species present in the system is given in sec. 4.16 of Denbigh.
6.6 SHIFTS IN IDEAL-GAS REACTION EQUILIBRIA
If T, P, or the composition of an ideal gas mixture in equilibrium is changed, the equi-
librium position may shift. We now examine the direction of such shifts.