
Page 31 - Physical Chemistry
P. 31
lev38627_ch01.qxd 2/20/08 11:38 AM Page 12
12
3
Chapter 1 The density of mercury at 0°C and 1 atm is 13.5951 g/cm . Converting this density to
Thermodynamics kg/m and using (1.9) with h 1 mm, we have
3
2
g 1 kg 10 cm 3
3
2
1 torr a13.5951 3 ba 3 ba b 19.80665 m>s 2110 m2
cm 10 g 1 m
2
1 2
1 torr 133.322 kg m s 133.322 N>m 133.322 Pa
since 1 N 1kgms 2 [Eq. (2.7)]. One atmosphere (atm) is defined as exactly 760 torr:
5
1 atm 760 torr 1.01325 10 Pa (1.10)
Another widely used pressure unit is the bar:
5
1 bar 10 Pa 0.986923 atm 750.062 torr (1.11)
The bar is slightly less than 1 atm. The approximation
1 bar 750 torr (1.12)*
will usually be accurate enough for our purposes. See Fig. 1.7.
3
3
Common units of volume are cubic centimeters (cm ), cubic decimeters (dm ),
3
3
cubic meters (m ), and liters (L or l). The liter is defined as exactly 1000 cm . One
3
3
3
3
3
3
3
liter equals 10 cm 10 (10 2 m) 10 3 m (10 1 m) 1 dm , where one
decimeter (dm) equals 0.1 m.
3
1 liter 1 dm 1000 cm 3 (1.13)*
Charles’ Law
Charles (1787) and Gay-Lussac (1802) measured the thermal expansion of gases and
found a linear increase in volume with temperature (measured on the mercury centi-
grade scale) at constant pressure and fixed amount of gas:
V a a u const. P, m (1.14)
1
2
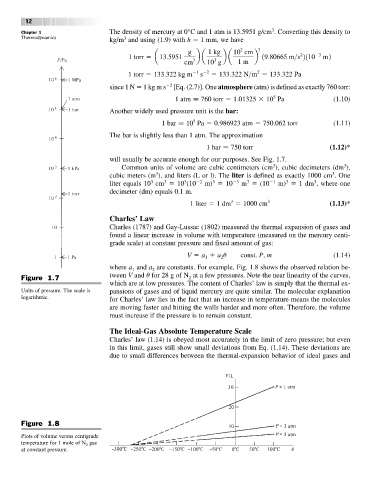
where a and a are constants. For example, Fig. 1.8 shows the observed relation be-
1 2
tween V and u for 28 g of N at a few pressures. Note the near linearity of the curves,
Figure 1.7 2
which are at low pressures. The content of Charles’ law is simply that the thermal ex-
Units of pressure. The scale is pansions of gases and of liquid mercury are quite similar. The molecular explanation
logarithmic.
for Charles’ law lies in the fact that an increase in temperature means the molecules
are moving faster and hitting the walls harder and more often. Therefore, the volume
must increase if the pressure is to remain constant.
The Ideal-Gas Absolute Temperature Scale
Charles’ law (1.14) is obeyed most accurately in the limit of zero pressure; but even
in this limit, gases still show small deviations from Eq. (1.14). These deviations are
due to small differences between the thermal-expansion behavior of ideal gases and
Figure 1.8
Plots of volume versus centigrade
temperature for 1 mole of N gas
2
at constant pressure.