
Page 42 - Physical Chemistry
P. 42
lev38627_ch01.qxd 2/20/08 11:38 AM Page 23
23
Forany extensive property of a pure one-phase system, we can define a corre- Section 1.7
sponding molar quantity. For example, the molar mass of a substance is m/n [Eq. (1.4)]. Equations of State
What about equations of state for real gases? We shall see in Chapter 14 that ig-
noring forces between the molecules leads to the ideal-gas equation of state PV
nRT. Actually, molecules initially attract each other as they approach and then repel
each other when they collide. To allow for intermolecular forces, van der Waals in
1873 modified the ideal-gas equation to give the van der Waals equation
an 2
a P b1V nb2 nRT (1.39)
V 2
Each gas has its own a and b values. Determination of a and b from experimental data is
discussed in Sec. 8.4, which lists some a and b values. Subtraction of nb from V corrects
for intermolecular repulsion. Because of this repulsion, the volume available to the gas
molecules is less than the volume V of the container. The constant b is approximately the
volume of one mole of the gas molecules themselves. (In a liquid, the molecules are quite
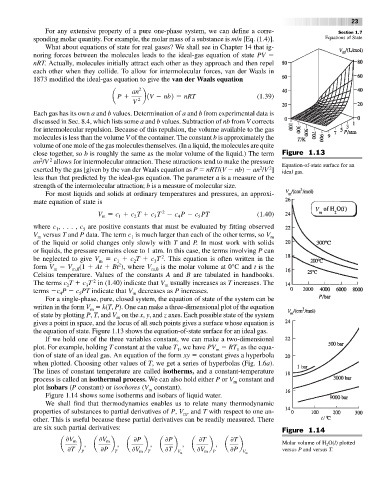
close together, so b is roughly the same as the molar volume of the liquid.) The term Figure 1.13
2
2
an /V allows for intermolecular attraction. These attractions tend to make the pressure Equation-of-state surface for an
2
2
exerted by the gas [given by the van der Waals equation as P nRT/(V nb) an /V ] ideal gas.
less than that predicted by the ideal-gas equation. The parameter a is a measure of the
strength of the intermolecular attraction; b is a measure of molecular size.
For most liquids and solids at ordinary temperatures and pressures, an approxi-
mate equation of state is
2
V c c T c T c P c PT (1.40)
1
3
2
m
4
5
where c , . . . , c are positive constants that must be evaluated by fitting observed
1
5
V versus T and P data. The term c is much larger than each of the other terms, so V m
1
m
of the liquid or solid changes only slowly with T and P. In most work with solids
or liquids, the pressure remains close to 1 atm. In this case, the terms involving P can
2
be neglected to give V c c T c T . This equation is often written in the
m
2
1
3
2
form V V m,0 (1 At Bt ), where V m,0 is the molar volume at 0°C and t is the
m
Celsius temperature. Values of the constants A and B are tabulated in handbooks.
2
The terms c T c T in (1.40) indicate that V usually increases as T increases. The
3
2
m
terms c P c PT indicate that V decreases as P increases.
m
4
5
Fora single-phase, pure, closed system, the equation of state of the system can be
written in the form V k(T, P). One can make a three-dimensional plot of the equation
m
of state by plotting P, T, and V on the x, y, and z axes. Each possible state of the system
m
gives a point in space, and the locus of all such points gives a surface whose equation is
the equation of state. Figure 1.13 shows the equation-of-state surface for an ideal gas.
If we hold one of the three variables constant, we can make a two-dimensional
plot. For example, holding T constant at the value T , we have PV RT as the equa-
1
m
1
tion of state of an ideal gas. An equation of the form xy constant gives a hyperbola
when plotted. Choosing other values of T, we get a series of hyperbolas (Fig. 1.6a).
The lines of constant temperature are called isotherms, and a constant-temperature
process is called an isothermal process. We can also hold either P or V constant and
m
plot isobars (P constant) or isochores (V constant).
m
Figure 1.14 shows some isotherms and isobars of liquid water.
We shall find that thermodynamics enables us to relate many thermodynamic
properties of substances to partial derivatives of P, V , and T with respect to one an-
m
other. This is useful because these partial derivatives can be readily measured. There
are six such partial derivatives: Figure 1.14
0V m 0V m 0P 0P 0T 0T
a b , a b , a b , a b , a b , a b Molar volume of H O(l) plotted
2
0T P 0P T 0V m T 0T V m 0V m P 0P V m versus P and versus T.