
Page 256 - Pipeline Risk Management Manual Ideas, Techniques, and Resources
P. 256
Assigning risk scores 11/233
Additional soil characteristics that are thought to impact metal- itively plausible. For example, some corrosion failures have
lic and concrete pipes include pH, chlorides, sulfates, and occurred in pipelines after less than a year in service, so a very
moisture. Some publicly available soils databases (such as low corrosion index score should reflect this. Although arhi-
USGS STATSGO) have ratings of corrosivity of steel and tray, this relationship is consistent, at least in general mathe-
corrosivity of concrete that can be used in a risk evaluation. matical terms, with many researchers’ conclusions that pipeline
A scoring protocol can be developed based on a basic under- break rates increase exponentially with the passage of time,
standing of material vulnerabilities. Table 11.3 illustrates a under the influence of corrosion.
basic scoring philosophy for the subsurface environment vari- The above relationship produces the corrosion rates shown
able. Factors thought to influence soil corrosivity are listed in in Table 1 1.4. Given an initial wall thickness, the time to cor-
the left column and their possible role in specific corrosion rode through the pipe wall can be estimated. An arbitrary initial
potential is shown in the right-most columns. Defaults can be wall thickness of 0.2 in. is selected to show the years before
used where no information is available and should be generally through-wall corrosion would occur. That is not necessarily the
conservative (that is, biased toward over-predicting corrosiv- time to failure, however, because even minor wall loss can con-
ity). For practical reasons, this may need to be tempered when tribute to a failure in a high-stress (usually from internal pres-
an extreme condition such as contamination is very unlikely for sure) situation, and, at the other extreme, pinhole leaks through
the vast majority of the pipeline. the pipe wall do not necessarily constitute failure under the
“excessive leakage” definition proposed.
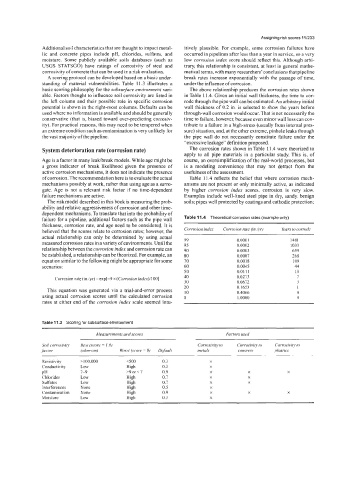
System deterioration rate (corrosion rate) The corrosion rates shown in Table 11.4 were theorized to
apply to all pipe materials in a particular study. This is, of
Age is a factor in many leakibreak models. While age might be course, an oversimplification of the real-world processes, but
a gross indicator of break likelihood given the presence of is a modeling convenience that may not detract from the
active corrosion mechanisms, it does not indicate the presence usefulness of the assessment.
of corrosion. The recommendation here is to evaluate the actual Table 11.4 reflects the belief that where corrosion mech-
mechanisms possibly at work, rather than using age as a surro- anisms are not present or only minimally active, as indicated
gate. Age is not a relevant risk factor if no time-dependent by higher corrosion index scores, corrosion is very slow.
failure mechanisms are active. Examples include well-lined steel pipe in dry, sandy, benign
The risk model described in this book is measuring the prob- soils; pipes well protected by coatings and cathodic protection;
ability and relative aggressiveness of corrosion and other time-
dependent mechanisms. To translate that into the probability of
failure for a pipeline, additional factors such as the pipe wall Table 11.4 Theoretical corrosion rates (example only)
thickness, corrosion rate, and age need to be considered. It is
believed that the scores relate to corrosion rates; however, the Corrosion index Corrosion rate (in.(vrJ Years to corrode
actual relationship can only be determined by using actual 99 0.0001 1481
measured corrosion rates in avariety of environments. Until the 95 0.0002 1033
relationship between the corrosion index and corrosion rate can 90 0.0003 659
be established, a relationship can be theorized. For example, an 80 0.0007 268
equation similar to the following might be appropriate for some 70 0.001 8 109
scenarios: 60 0.0045 44
50 0.01 11 I8
Corrosion rate (in./yr) = exp[-9 x (Corrosion Index)/l00] 40 0.0273 7
30 0.0672 3
20 0.1653 I
This equation was generated via a trial-and-error process 10 0.4066 0
using actual corrosion scores until the calculated corrosion 0 1 .a000 0
rates at either end of the corrosion index scale seemed intu-
Table 11.3 Scoring for subsurface environment
Measurements and scores Factors used
Soil corrosivio’ Be.st (score = 1.0) Corrosivity to Cormsivit?: tu Corrosivr f?. to
factor (ohm-em) Wor.st (score = 0) Default metals concrete plastrcs
Resistivity > 100,000 400 0.3 X
Conductivity Low High 0.3 X
PH 7-9 >9or< 7 0.9 X
Chlorides Low High 0.7 X
Sulfates Low High 0.7 X
Interferences None High 0.5 X
Contamination None High 0.9 X
Moisture Low High 0.3 X