
Page 27 - Pipeline Risk Management Manual Ideas, Techniques, and Resources
P. 27
they reach the end of their useful service life. Where a time-
dependent failure mechanism (corrosion or fatigue) is involved,
its effects will be observed in this wear-outphase of the curve.
An examination of the failure data of a particular system may
ul suggest such a curve and theoretically tell the evaluator what
2?
- stage the system is in and what can be expected. Failure rates
.-
3
m I are further discussed in Chapter 14.
LL I
c I
0 I Consequences
t
n I Inherent in any risk evaluation is a judgment of the potential
I
f
I
z consequences. This is the last of the three risk-defining ques-
I I tions: If something goes wrong, what are the consequences?
I I
Consequence implies a loss of some kind. Many of the
!
I Time - aspects of potential losses are readily quantified. In the case
of a major hydrocarbon pipeline accident (product escaping,
perhaps causing an explosion and fire), we could quantify
Figure 1.1 Common failure rate curve (bathtub curve) losses such as damaged buildings, vehicles, and other prop-
erty; costs of service interruption; cost of the product lost; cost
of the cleanup; and so on. Consequences are sometimes
Some pieces of equipment or installations have a high initial grouped into direct and indirect categories, where direct costs
rate of failure. This first portion of the curve is called the burn- include
inphase or infant mortalityphase. Here, defects that developed
during initial manufacture of a component cause failures. As Property damages
these defects are eliminated, the curve levels off into the second Damages to human health
zone. This is the so-called constant failurezone and reflects the Environmental damages
phase where random accidents maintain a fairly constant fail- Loss ofproduct
ure rate. Components that survive the bum-in phase tend to fail Repair costs
at a constant rate. Failure mechanisms that are more random in Cleanup and remediation costs
nature-third-party damages or most land movements for
example-tend to drive the failure rate in this part of the curve. Indirect costs can include litigation, contract violations, cus-
Far into the life of the component, the failure rate may begin tomer dissatisfaction, political reactions, loss of market share,
to increase. This is the zone where things begin to wear out as and government fines and penalties.
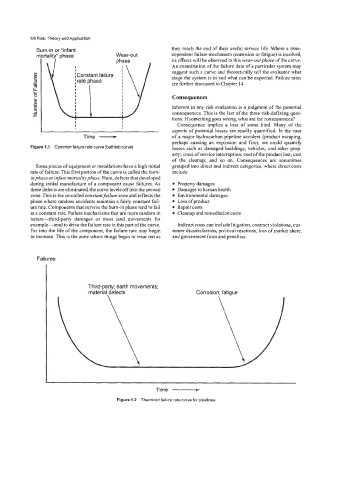
Failures
Third-party; earth movements;
material<defects Corrosion; fatigue
Time -
Figure 1.2 Theorized failure rate curve for pipelines.