
Page 152 - Pipelines and Risers
P. 152
Vortex-induced Vibratiom (Vlv) and Fatigue 125
9.3.2 S-N Curves
When the stress range S (Le. the double stress amplitude) has been established for a range of
values of Vr, the expected fatigue damage shall be calculated by means of S-N curves.
In case Stress Concentration Factor is not applied, it is proposed that the F2 S-N curve for
submerged structures in seawater is used in the detailed design, thus
log a is constant equal to 11.63
m is the fatigue exponent, which is equal to 3.
9.4 Response Amplitude
9.4.1 In-line VIV in Current Dominated Conditions
This section applies to current dominated situations only, i.e. for a > 0.8 or a > 0.5.
Onset of In-line Vibrations
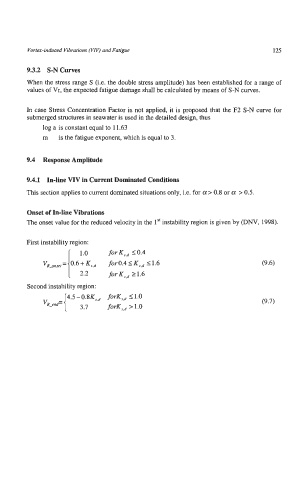
The onset value for the reduced velocity in the 1'' instability region is given by (DNV, 1998).
First instability region:
1 .o for K3,d 20.4
for 0.4 I Ks.d I 1.6 (9.6)
for Ks,d 2 1.6
Second instability region:
r.5 -;;PKs.d forK,,, 51.0
VR_end= forK,., > 1.0 (9.7)