
Page 25 - Planning and Design of Airports
P. 25
6 Airp o r t Pl anning
Annual Annual Annual
Growth, Civil Growth, Growth,
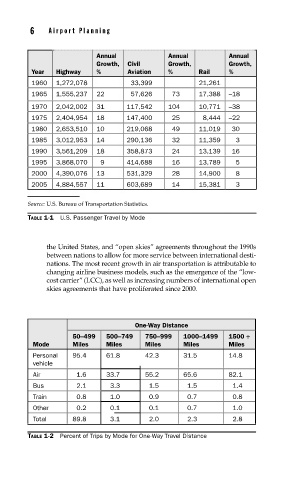
Year Highway % Aviation % Rail %
1960 1,272,078 33,399 21,261
1965 1,555,237 22 57,626 73 17,388 –18
1970 2,042,002 31 117,542 104 10,771 –38
1975 2,404,954 18 147,400 25 8,444 –22
1980 2,653,510 10 219,068 49 11,019 30
1985 3,012,953 14 290,136 32 11,359 3
1990 3,561,209 18 358,873 24 13,139 16
1995 3,868,070 9 414,688 16 13,789 5
2000 4,390,076 13 531,329 28 14,900 8
2005 4,884,557 11 603,689 14 15,381 3
Source: U.S. Bureau of Transportation Statistics.
TABLE 1-1 U.S. Passenger Travel by Mode
the United States, and “open skies” agreements throughout the 1990s
between nations to allow for more service between international desti-
nations. The most recent growth in air transportation is attributable to
changing airline business models, such as the emergence of the “low-
cost carrier” (LCC), as well as increasing numbers of international open
skies agreements that have proliferated since 2000.
One-Way Distance
50–499 500–749 750–999 1000–1499 1500 +
Mode Miles Miles Miles Miles Miles
Personal 95.4 61.8 42.3 31.5 14.8
vehicle
Air 1.6 33.7 55.2 65.6 82.1
Bus 2.1 3.3 1.5 1.5 1.4
Train 0.8 1.0 0.9 0.7 0.8
Other 0.2 0.1 0.1 0.7 1.0
Total 89.8 3.1 2.0 2.3 2.8
TABLE 1-2 Percent of Trips by Mode for One-Way Travel Distance