
Page 27 - Planning and Design of Airports
P. 27
8 Airp o r t Pl anning
Average
Enplaned Passenger Trip Average
Passengers Miles Length Number Seats per
Year (thousands) (millions) (miles) of Aircraft Aircraft
1970 4,270 399 98 741 11
1975 7,243 689 110 948 13
1980 14,810 1,920 129 1,339 14
1985 26,000 4,410 173 1,745 19
1990 42,099 7,610 183 1,917 22
1995 55,800 11,461 213 2,109 30
2000 82,800 23,638 285 2,275 39
2003 112,120 43,100 384 2,189 45
2007 161,390 73,690 457 2,579 51
TABLE 1-3 Commuter and Regional Airline Statistics 1970 to 2007
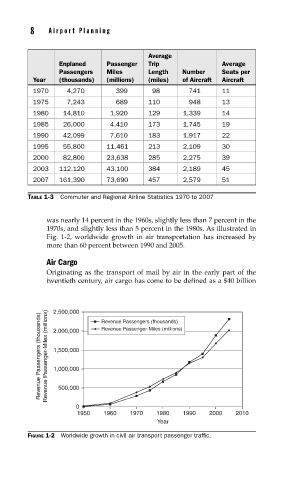
was nearly 14 percent in the 1960s, slightly less than 7 percent in the
1970s, and slightly less than 5 percent in the 1980s. As illustrated in
Fig. 1-2, worldwide growth in air transportation has increased by
more than 60 percent between 1990 and 2005.
Air Cargo
Originating as the transport of mail by air in the early part of the
twentieth century, air cargo has come to be defined as a $40 billion
2,500,000
Revenue Passengers (thousands) Revenue Passenger-Miles (millions) 2,000,000 Revenue Passengers (thousands)
Revenue Passenger-Miles (millions)
1,500,000
1,000,000
500,000
0
1950 1960 1970 1980 1990 2000 2010
Year
FIGURE 1-2 Worldwide growth in civil air transport passenger traffi c.