
Page 301 - Planning and Design of Airports
P. 301
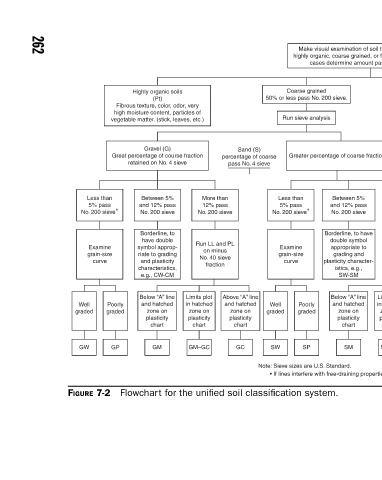
Make visual examination of soil to determine whether its highly organic, coarse grained, or fine grained. In border-line cases determine amount passing No. 200 sieve  Fine grained more than 50% pass No. 200 sieve.  Run LL and PL on minus 40 sieve material  H  L Greater percentage of coarse fraction Liquid limit great

                  50% or less pass No. 200 sieve.
                      Run sieve analysis
                 Coarse grained


                           Sand (S)  percentage of coarse  pass No. 4 sieve  Less than  5% pass  No. 200 sieve ∗  Examine  grain-size  curve  Above “A” line  Poorly  Well and hatched  graded graded zone on  plasticity  chart  SP  SW  GC  Note: Sieve sizes are U.S. Standard.


                                   More than  12% pass  No. 200 sieve  Run LL and PL  on minus  No. 40 sieve  fraction  Limits plot  in hatched  zone on  plasticity  chart  GM–GC  Flowchart for the unified soil classification system.


                 Highly organic soils  (Pt) Fibrous texture, color, odor, very high moisture content, particles of vegetable matter. (stick, leaves, etc.)  Gravel (G) Great percentage of course fraction retained on No. 4 sieve  Between 5%  and 12% pass  No. 200 sieve  Borderline, to  have double  symbol approp-  riate to gradi


                                   Less than  5% pass  No. 200 sieve ∗  Examine  grain-size  curve  Poorly  Well  graded graded  GP  GW  FIGURE 7-2


       262